Fig. 7
Download original image
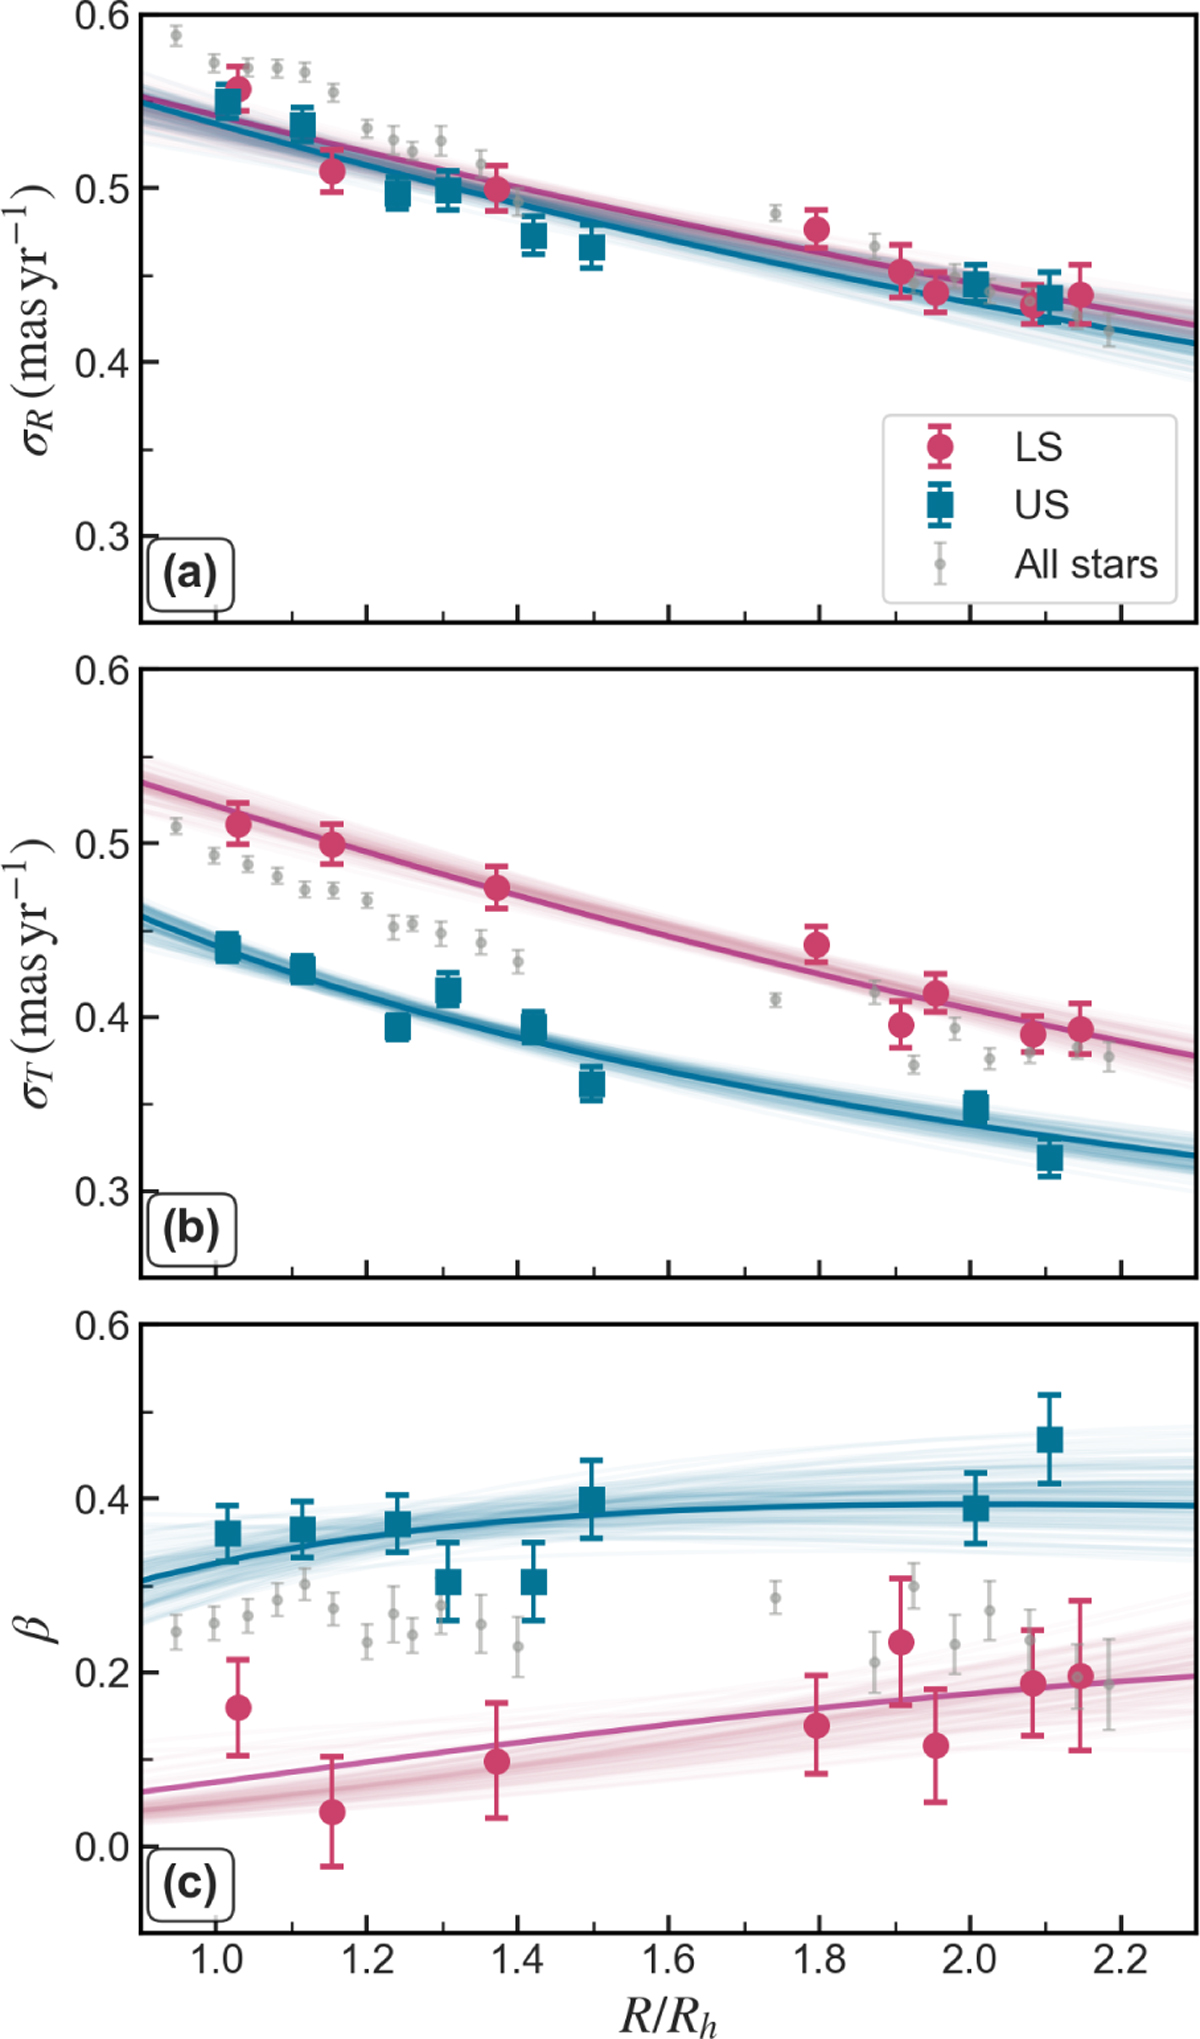
Radial profiles of the velocity dispersion in the radial (a) and tangential (b) components. Panel (c) shows the anisotropy profiles, with β = 1 − (σT /σR)2. Blue squared markers represent the US population, red dots the LS population, and gray points all stars. The best-fit models for US and LS stars are indicated by dark blue and red lines, respectively. The radial coordinate is normalized to the half-light radius, Rh = 5.0 arcmin.
Current usage metrics show cumulative count of Article Views (full-text article views including HTML views, PDF and ePub downloads, according to the available data) and Abstracts Views on Vision4Press platform.
Data correspond to usage on the plateform after 2015. The current usage metrics is available 48-96 hours after online publication and is updated daily on week days.
Initial download of the metrics may take a while.