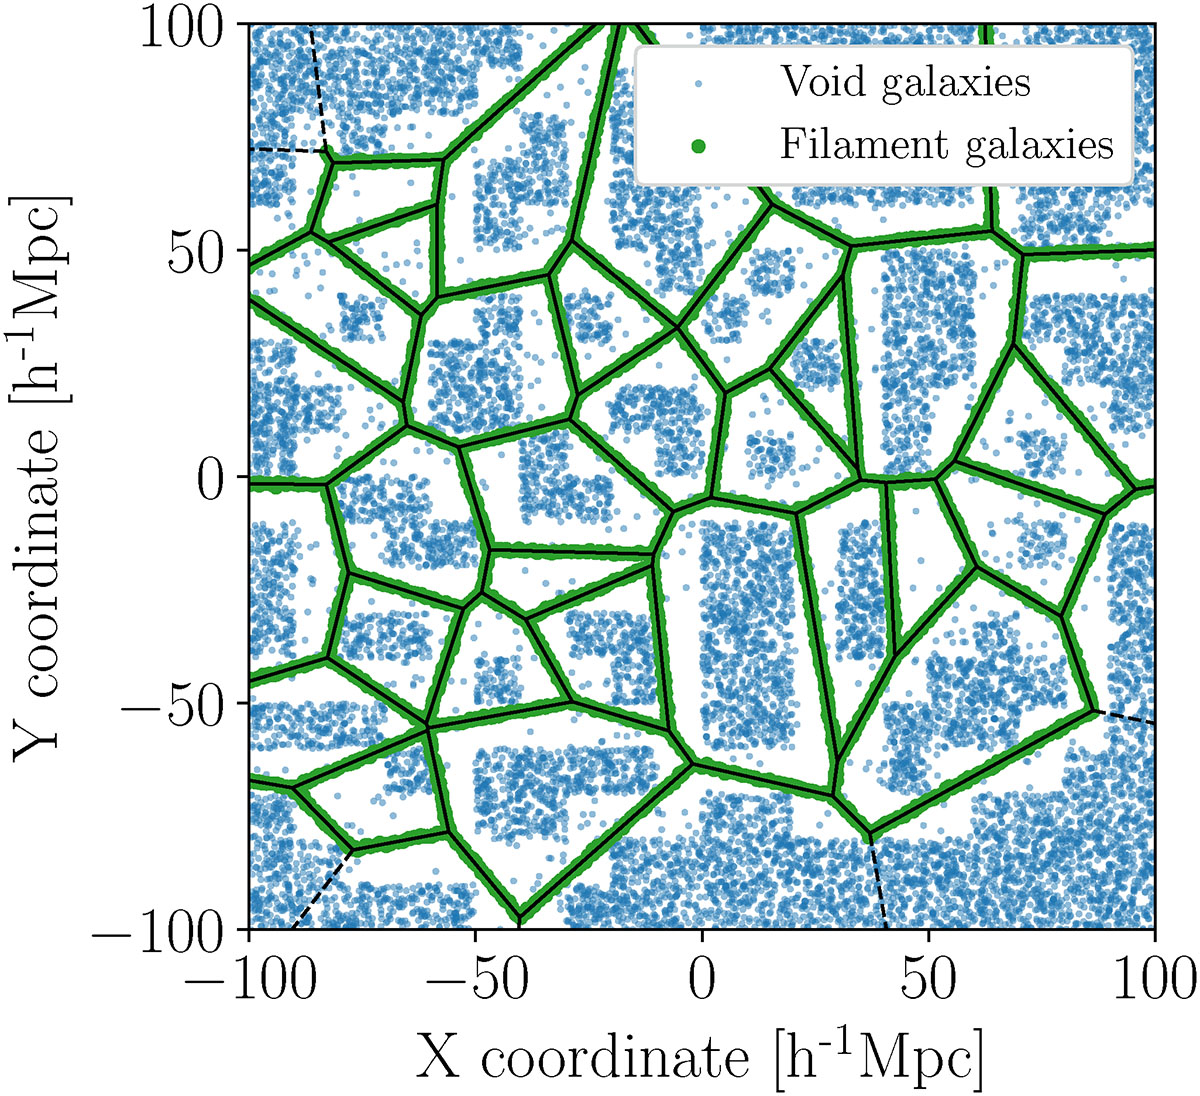
Fig. D.4.
Download original image
2D example of the under-dense areas in the void galaxies generation method. The figure shows a Voronoi tessellation of a surface. Black lines represents the filaments which were populated with galaxies (green dots). Blue dots represents generated uniformly distributed void galaxies. The threshold was exaggerated to highlight how the algorithm skips areas previously populated with galaxies from other structures.
Current usage metrics show cumulative count of Article Views (full-text article views including HTML views, PDF and ePub downloads, according to the available data) and Abstracts Views on Vision4Press platform.
Data correspond to usage on the plateform after 2015. The current usage metrics is available 48-96 hours after online publication and is updated daily on week days.
Initial download of the metrics may take a while.