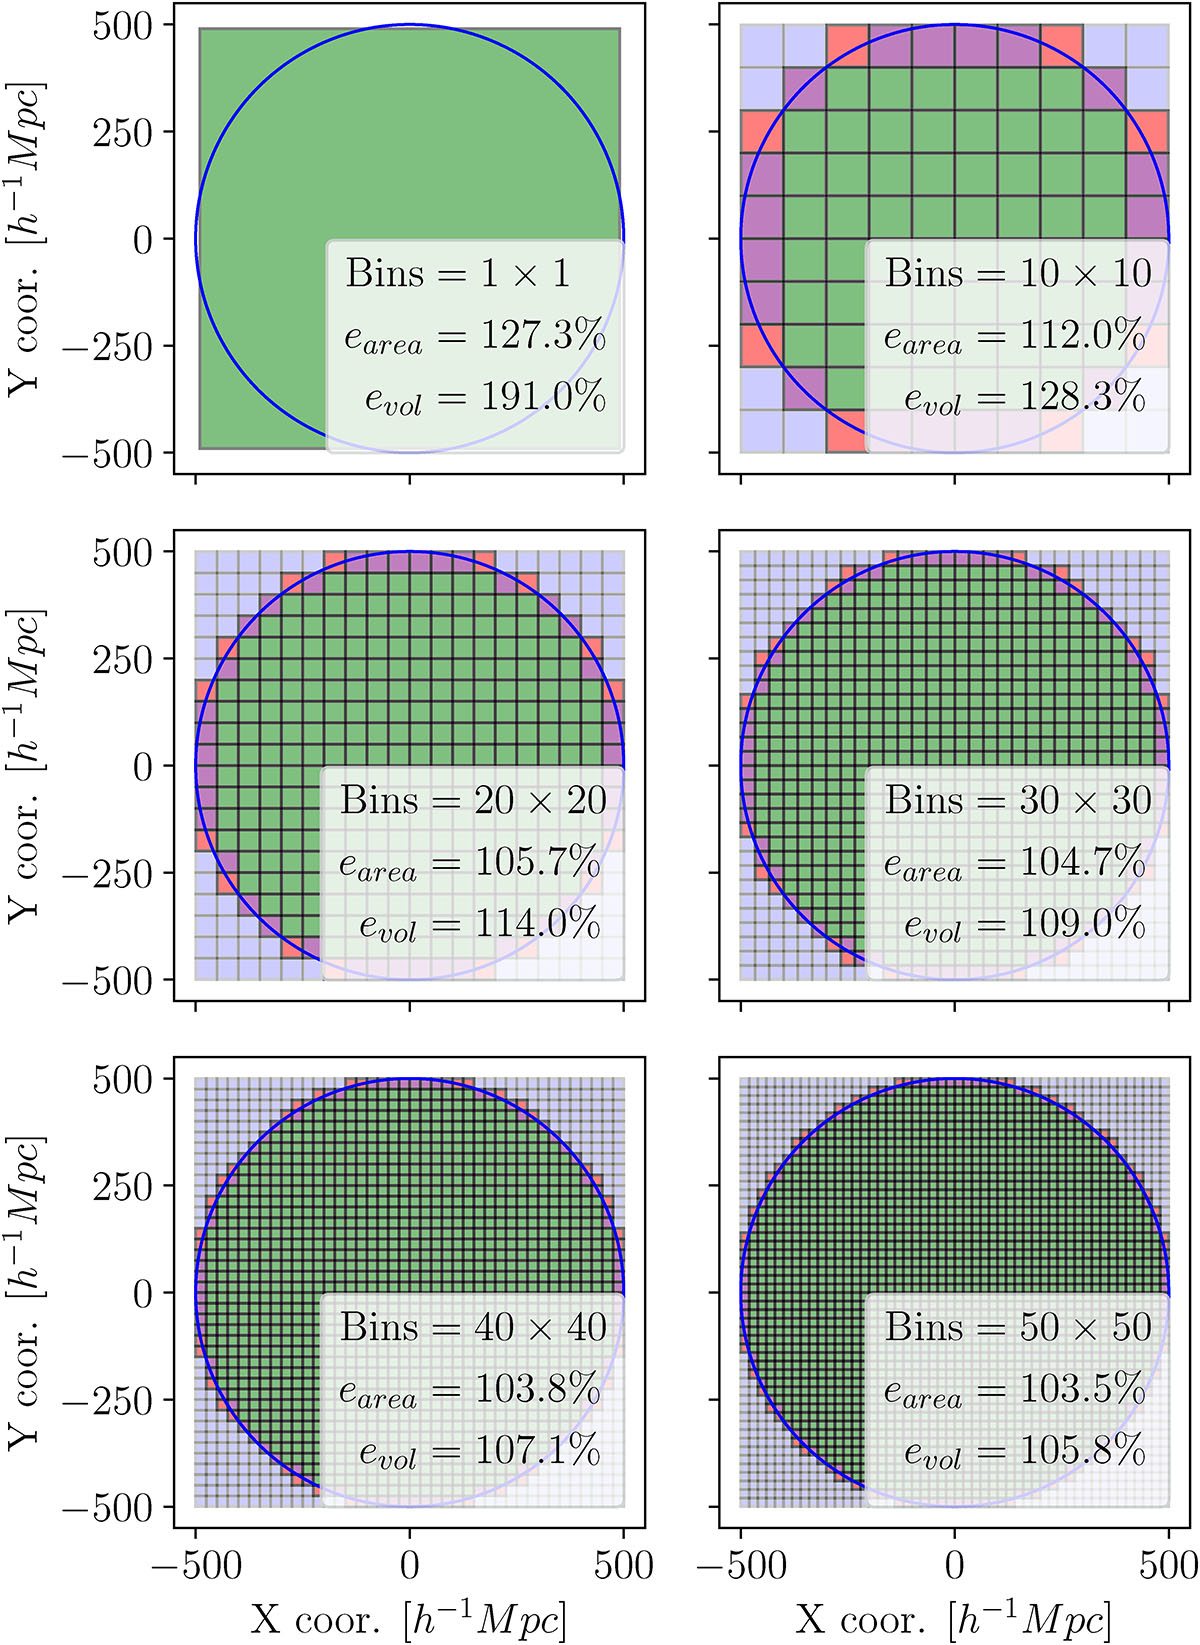
Fig. D.5.
Download original image
Effect of sampling the sphere volume using different voxel sizes. The figure shows a 2D representation of the simulated spherical universe (blue circle). The voxel volume method will divide the space in voxels, represented as coloured squares. Those voxels which their centres are further than the simulated universe radius (500 [h−1Mpc] in this example) will not be processed, represented in light blue. The remaining voxels will be taken into account to compute the volume of the structures. While inner voxels present no problem (green ones), frontier voxels are adding more volume erratically because cubes cannot precisely fit the surface of a sphere. While purple voxels add small errors, red voxels are adding the expected volume twice or more for that zone. This 2D example shows how the proportion between the computed and theoretical areas (represented by earea) decreases proportionally with the bin size. In 3D, it occurs in the same way with computed and theoretical volumes, represented by evol.
Current usage metrics show cumulative count of Article Views (full-text article views including HTML views, PDF and ePub downloads, according to the available data) and Abstracts Views on Vision4Press platform.
Data correspond to usage on the plateform after 2015. The current usage metrics is available 48-96 hours after online publication and is updated daily on week days.
Initial download of the metrics may take a while.