Open Access
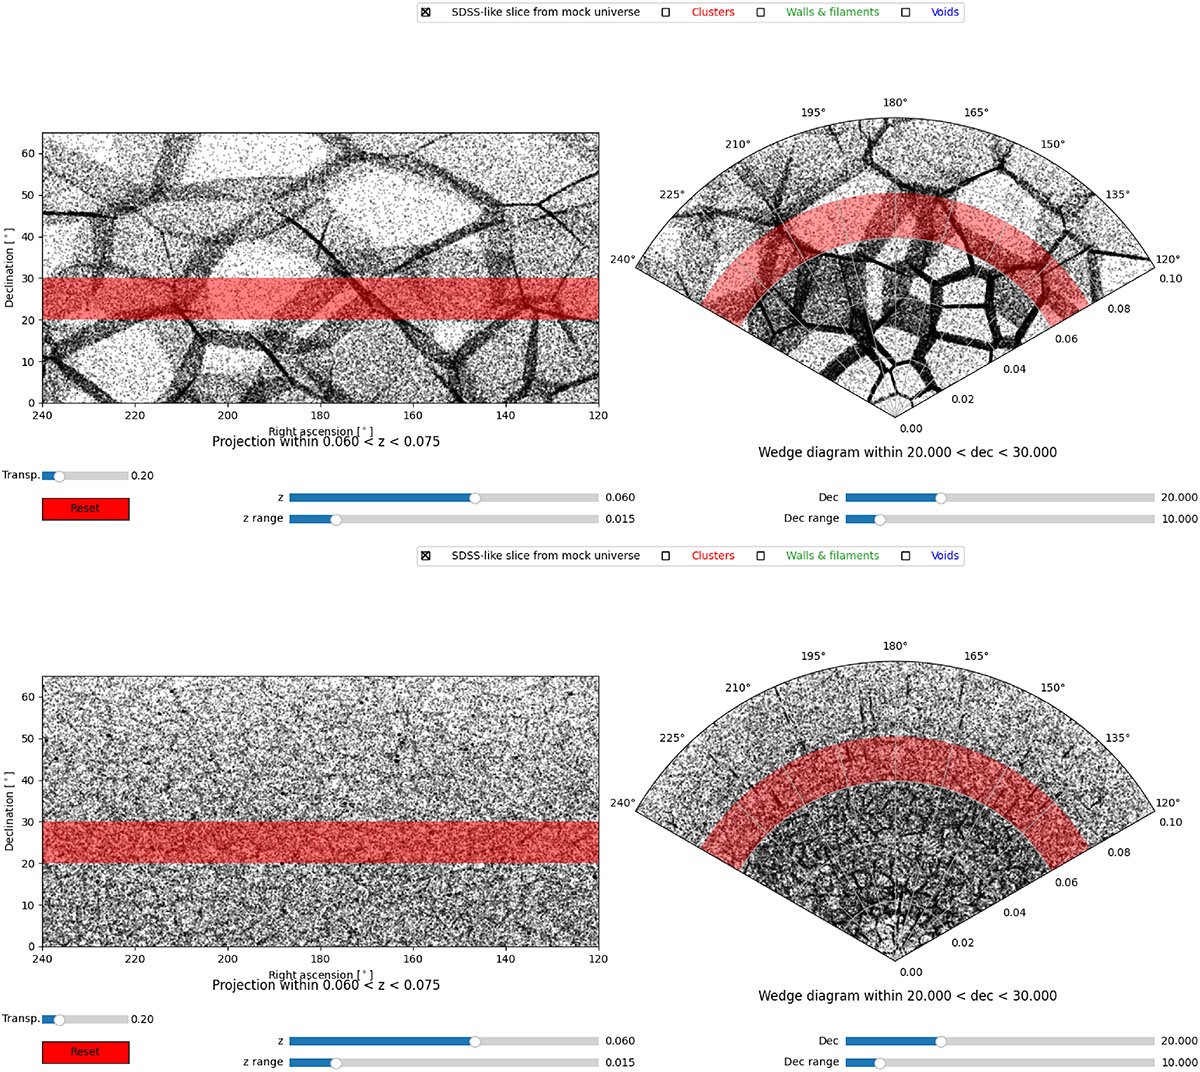
Fig. D.6.
Download original image
SDSS-like slice II from two randomly generated mock universes with ten times fewer (upper panel) and ten times more (lower panel) voids than in default configuration. In both panels, the red stripes represent the range of redshift and declination shown in the other sub-panel.
Current usage metrics show cumulative count of Article Views (full-text article views including HTML views, PDF and ePub downloads, according to the available data) and Abstracts Views on Vision4Press platform.
Data correspond to usage on the plateform after 2015. The current usage metrics is available 48-96 hours after online publication and is updated daily on week days.
Initial download of the metrics may take a while.