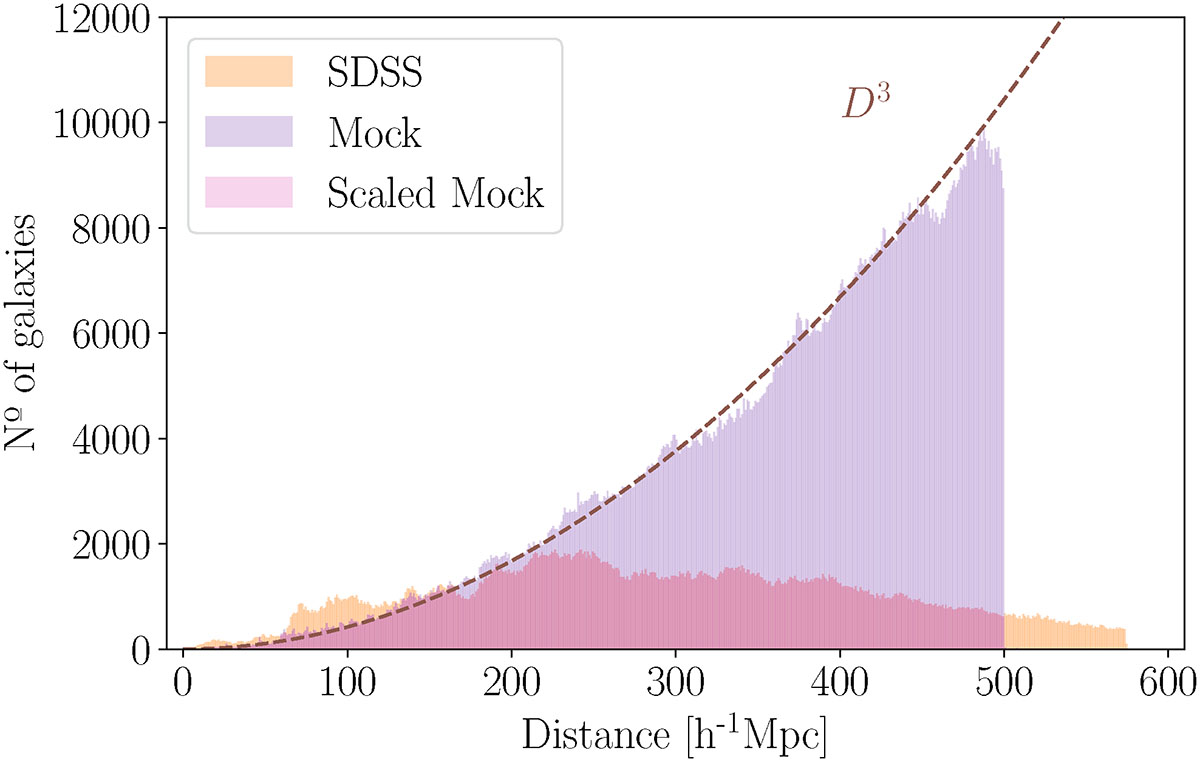
Fig. 8.
Download original image
Simulated Malmquist bias. Orange histogram shows the distribution of the number of sampled galaxies in the observational reference catalogue along the distance from origin. Purple histogram shows the distribution of the number of generated mock galaxies in the mock catalogue along the distance from origin. Pink histogram shows the distribution of the number of the selected mock galaxies in the mock catalogue along the distance from origin, after discarding some mock galaxies randomly to follow the behaviour of the observational catalogue. Brown dashed line gives the expected number of galaxies for a constant volume density of galaxies within the universe.
Current usage metrics show cumulative count of Article Views (full-text article views including HTML views, PDF and ePub downloads, according to the available data) and Abstracts Views on Vision4Press platform.
Data correspond to usage on the plateform after 2015. The current usage metrics is available 48-96 hours after online publication and is updated daily on week days.
Initial download of the metrics may take a while.