Fig. 9.
Download original image
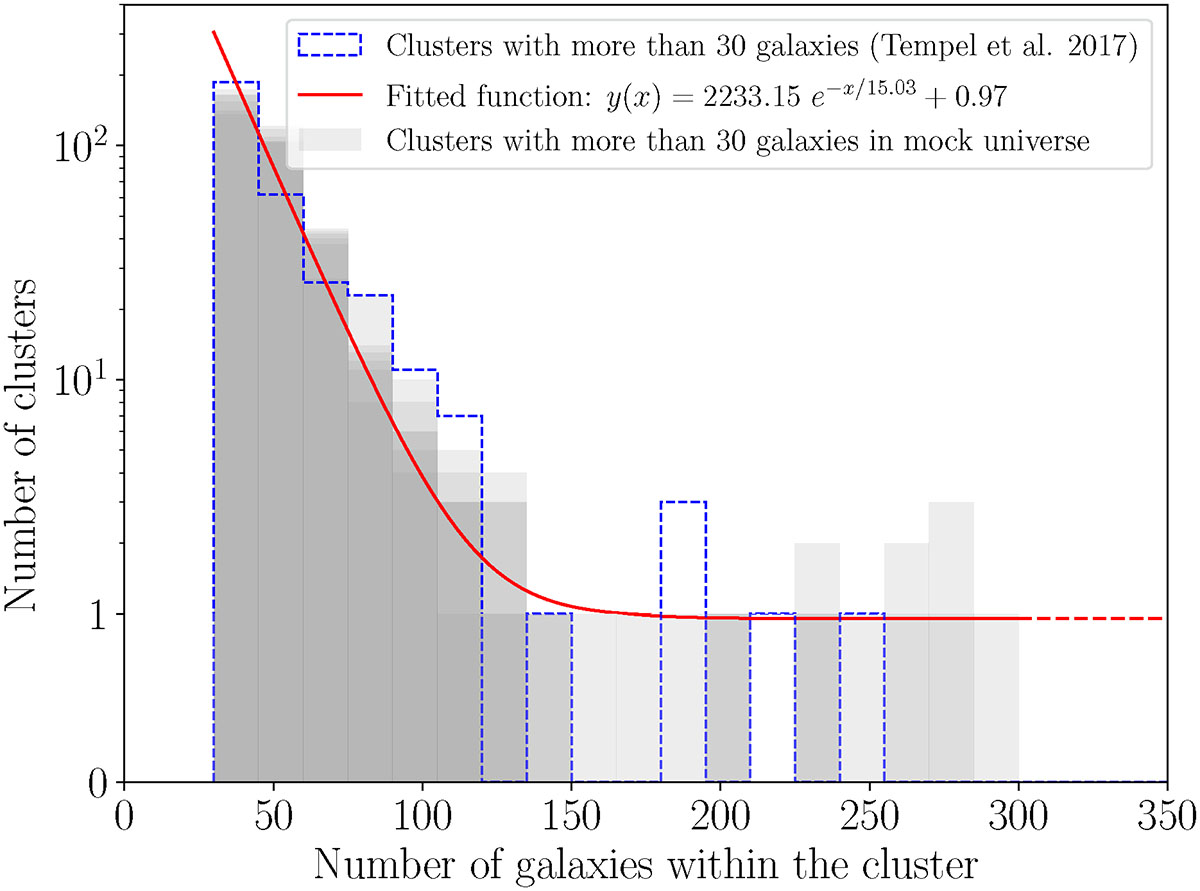
Count of clusters as a function of their number of galaxies in Tempel et al. (2017) and in the simulated mock universe. Dashed blue line shows the number of clusters in Tempel et al. (2017). Red line shows the fitted function over the data from the reference catalogue. Grey bars show the number of clusters in each slice of the studied mock catalogue.
Current usage metrics show cumulative count of Article Views (full-text article views including HTML views, PDF and ePub downloads, according to the available data) and Abstracts Views on Vision4Press platform.
Data correspond to usage on the plateform after 2015. The current usage metrics is available 48-96 hours after online publication and is updated daily on week days.
Initial download of the metrics may take a while.