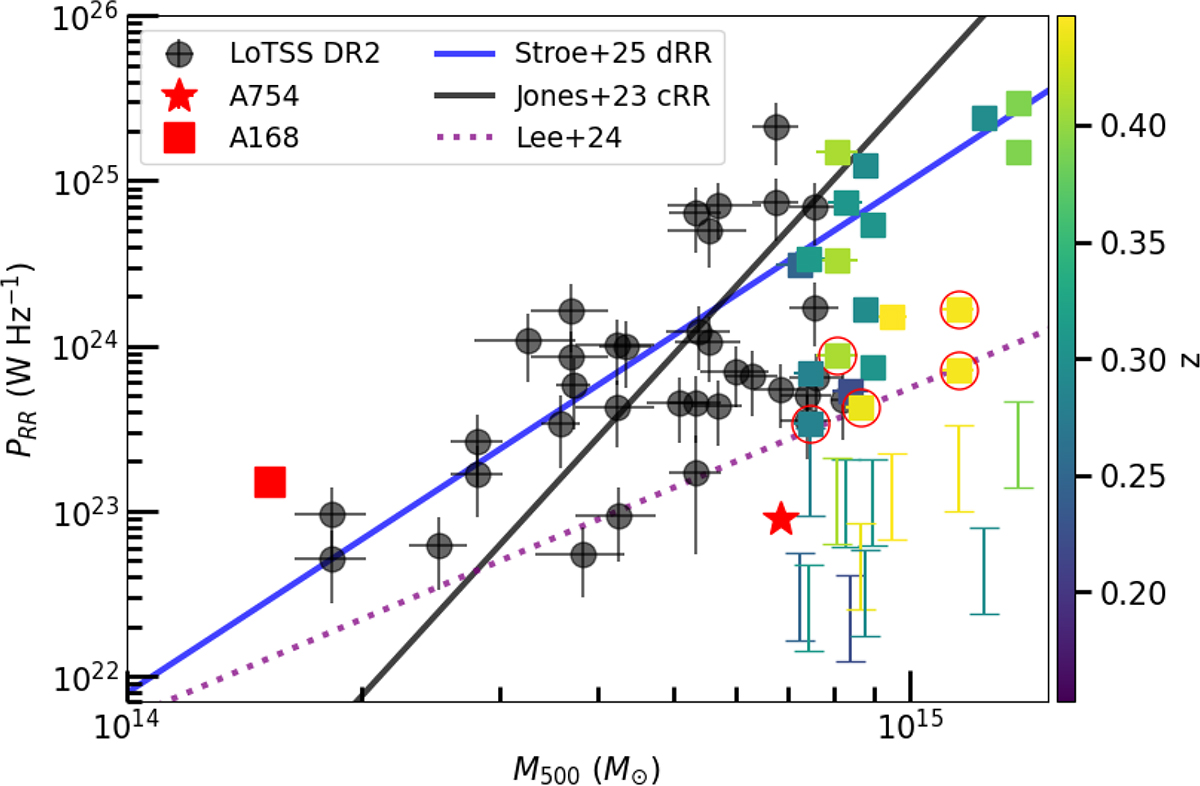
Fig. 17.
Download original image
Radio relic power – mass relation of our sample at 1.28 GHz (squares with red circles for candidate relics) compared with literature results. The black points represent relics from the LoTSS-DR2 described in Jones et al. (2023), while the red square and the red star represent the relics in A168 (Dwarakanath et al. 2018) and A754 (error bars fall below point size; Botteon et al. 2024). The best-fit relations by both observations (Jones et al. 2023; Stroe et al. 2025, dashed lines) and simulations (Lee et al. 2024, dotted lines) are also reported. The coloured bars indicate the detection thresholds for each of our observations where we detected relic emission as explained in the main text.
Current usage metrics show cumulative count of Article Views (full-text article views including HTML views, PDF and ePub downloads, according to the available data) and Abstracts Views on Vision4Press platform.
Data correspond to usage on the plateform after 2015. The current usage metrics is available 48-96 hours after online publication and is updated daily on week days.
Initial download of the metrics may take a while.