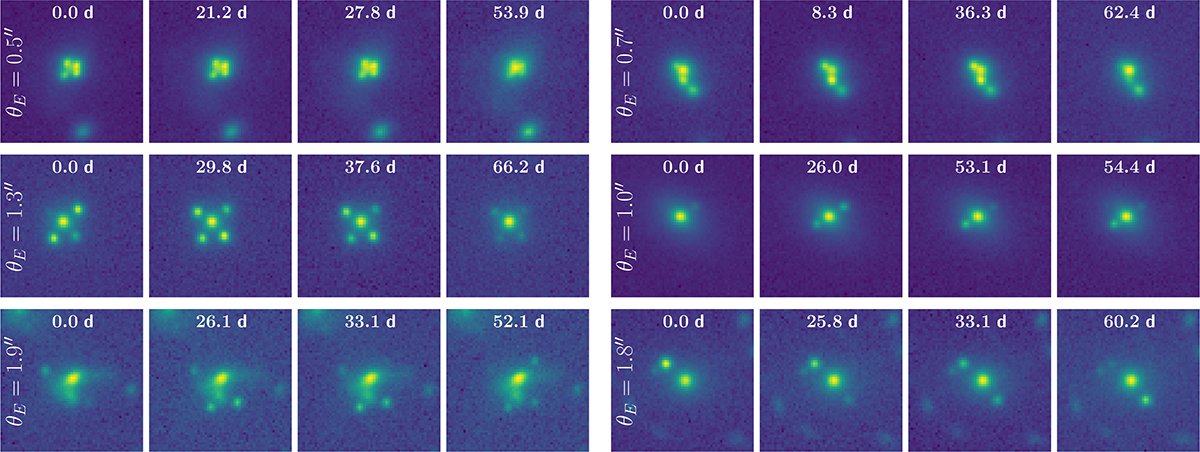
Fig. A.2.
Download original image
Examples of time series of mock LSNe Ia systems in i-band. The three rows correspond to systems with smaller (top), intermediate (middle), and larger (bottom) Einstein radii, with the specific values indicated at the first time step of each series. Time stamps, relative to the first observation, are displayed at the top of each frame. The time sampling follows the HSC Transient Survey cadence, as discussed in Section 2.6 and detailed further in Appendix B. In each row, two systems are presented: a quad on the left and a double on the right. For visual clarity, we show in this figure systems with prominent lensing features; however, many samples in the training set exhibit more subtle and less easily identifiable signals. Still, some examples shown here include foreground or background contaminants, reflecting the observational complexities incorporated in the training data.
Current usage metrics show cumulative count of Article Views (full-text article views including HTML views, PDF and ePub downloads, according to the available data) and Abstracts Views on Vision4Press platform.
Data correspond to usage on the plateform after 2015. The current usage metrics is available 48-96 hours after online publication and is updated daily on week days.
Initial download of the metrics may take a while.