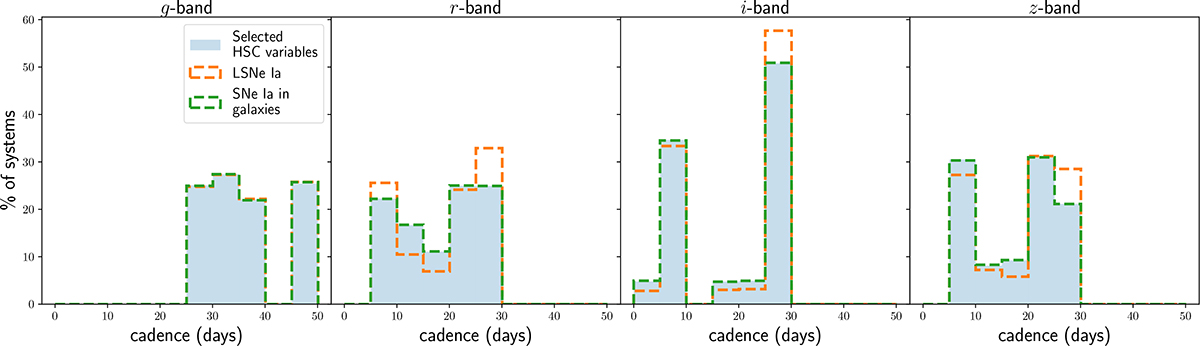
Fig. B.1.
Download original image
The cadence distributions for different components across four bands are shown in four panels. HSC variables are selected with “good" cadences according to the criteria described in Appendix B. We then match the cadence distributions of our simulated time series to those of the selected observed HSC variables, separately for each band. Due to the additional requirement of capturing at least the second trailing image for the LSNe Ia, their cadence distribution tends to slightly favor coarse cadence, i.e. larger gaps between successive observations.
Current usage metrics show cumulative count of Article Views (full-text article views including HTML views, PDF and ePub downloads, according to the available data) and Abstracts Views on Vision4Press platform.
Data correspond to usage on the plateform after 2015. The current usage metrics is available 48-96 hours after online publication and is updated daily on week days.
Initial download of the metrics may take a while.