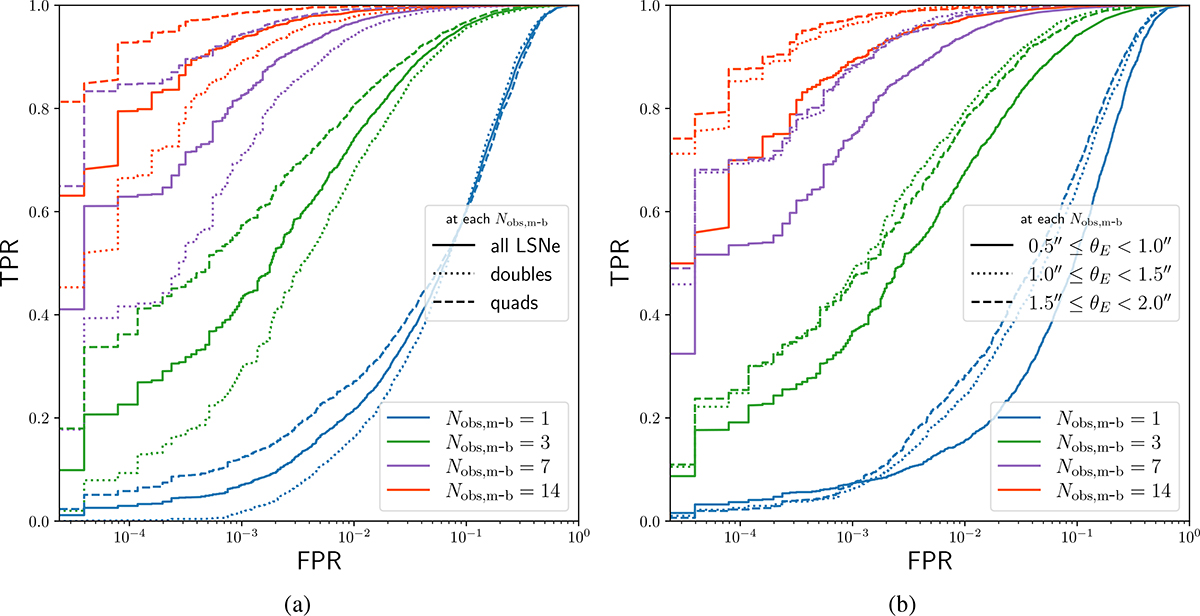
Fig. D.2.
Download original image
Comparison of classification performance across different sub-classes of LSNe Ia systems using ROC curves. The left panel compares doubles and quads, while the right panel shows results for systems grouped by angular separation, highlighting the impact of image separation. Results at the 1st, 3rd, 7th, and 14th observation epochs are shown in blue, green, purple, and orange, respectively, in both panels. In the left panel, solid, dotted, and dashed curves of a given color represent all LSNe Ia, doubles, and quads, respectively; in the right panel, the same line styles denote the three θE bins at the corresponding observation epoch.
Current usage metrics show cumulative count of Article Views (full-text article views including HTML views, PDF and ePub downloads, according to the available data) and Abstracts Views on Vision4Press platform.
Data correspond to usage on the plateform after 2015. The current usage metrics is available 48-96 hours after online publication and is updated daily on week days.
Initial download of the metrics may take a while.