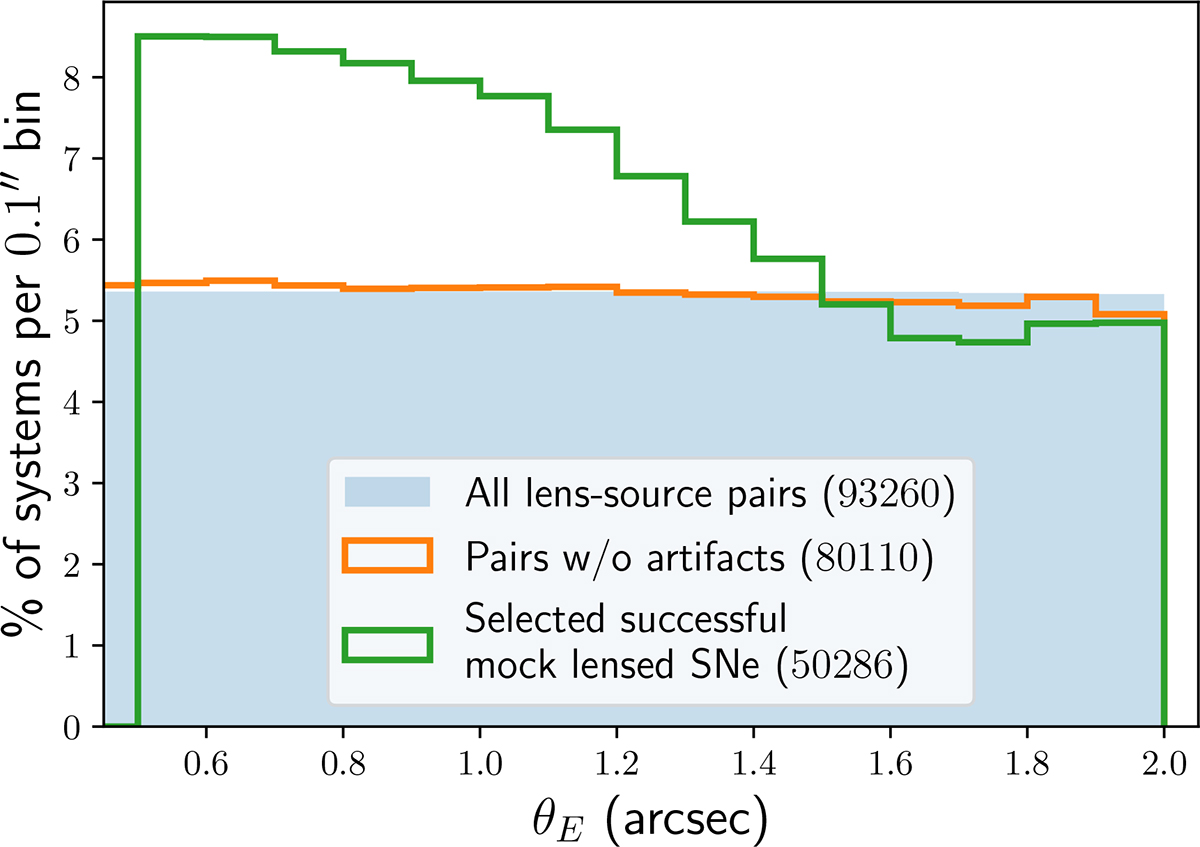
Fig. 2.
Download original image
Einstein radius (θE) distributions. The blue histogram shows the ∼93 000 lens–source pairs with a flat θE distribution between 0.1″ and 2.0″. After removing artifacts, ∼80 000 clean systems (orange) remained that still follow a flat θE distribution. The green histogram shows the final ∼50 000 mock LSNe Ia passing our brightness selection and restricted to θE > 0.5″, which delimits the region of interest in this study. Of these, ∼48 000 are used in the training, validation, and test sets with a balanced number of doubles and quads.
Current usage metrics show cumulative count of Article Views (full-text article views including HTML views, PDF and ePub downloads, according to the available data) and Abstracts Views on Vision4Press platform.
Data correspond to usage on the plateform after 2015. The current usage metrics is available 48-96 hours after online publication and is updated daily on week days.
Initial download of the metrics may take a while.