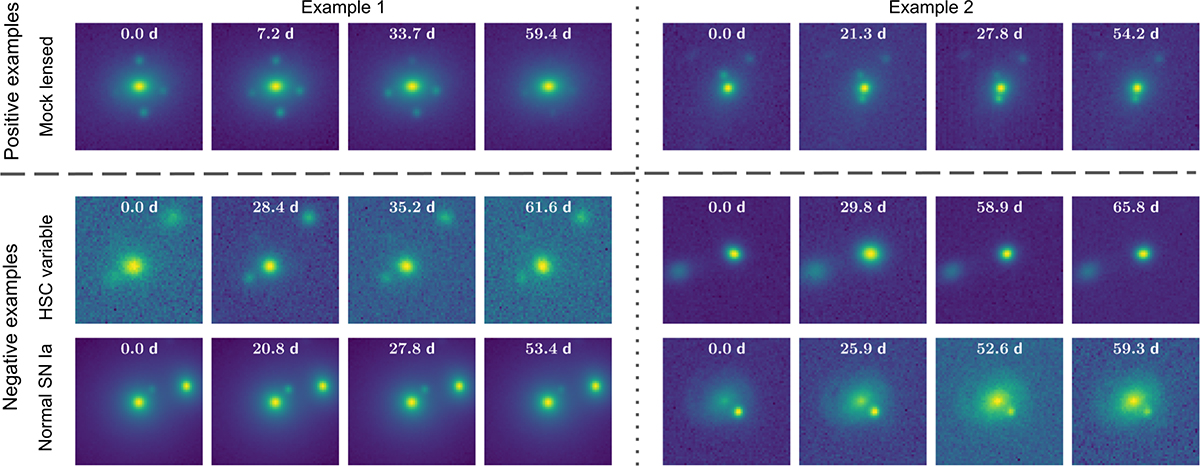
Fig. 3.
Download original image
Example i-band time series of different components used for training: mock LSNe Ia (top row, forming the positive class), and variable sources and normal SNe Ia (middle and bottom rows, forming the negative class). Each row shows two representative samples. The top row includes a quadruply LSN Ia (left) and a doubly lensed one (right). The middle row shows two unrelated HSC variables, where the central objects exhibit variability over time. The bottom row shows an SN Ia in an LRG (left) and in a spiral galaxy (right). Note that, only the time series of the HSC variables in the middle row include PSF variation over time. Timestamps in each frame indicate days since the first detection, which is always set to zero. The classification task is binary: distinguishing LSNe Ia from all other types of transients and bogus detections. For illustration, we show only single-band (i-band) time series here. The multiband time series corresponding to the quadruply LSN Ia shown in the top-left panel is presented in Figure 5.
Current usage metrics show cumulative count of Article Views (full-text article views including HTML views, PDF and ePub downloads, according to the available data) and Abstracts Views on Vision4Press platform.
Data correspond to usage on the plateform after 2015. The current usage metrics is available 48-96 hours after online publication and is updated daily on week days.
Initial download of the metrics may take a while.