Fig. 4.
Download original image
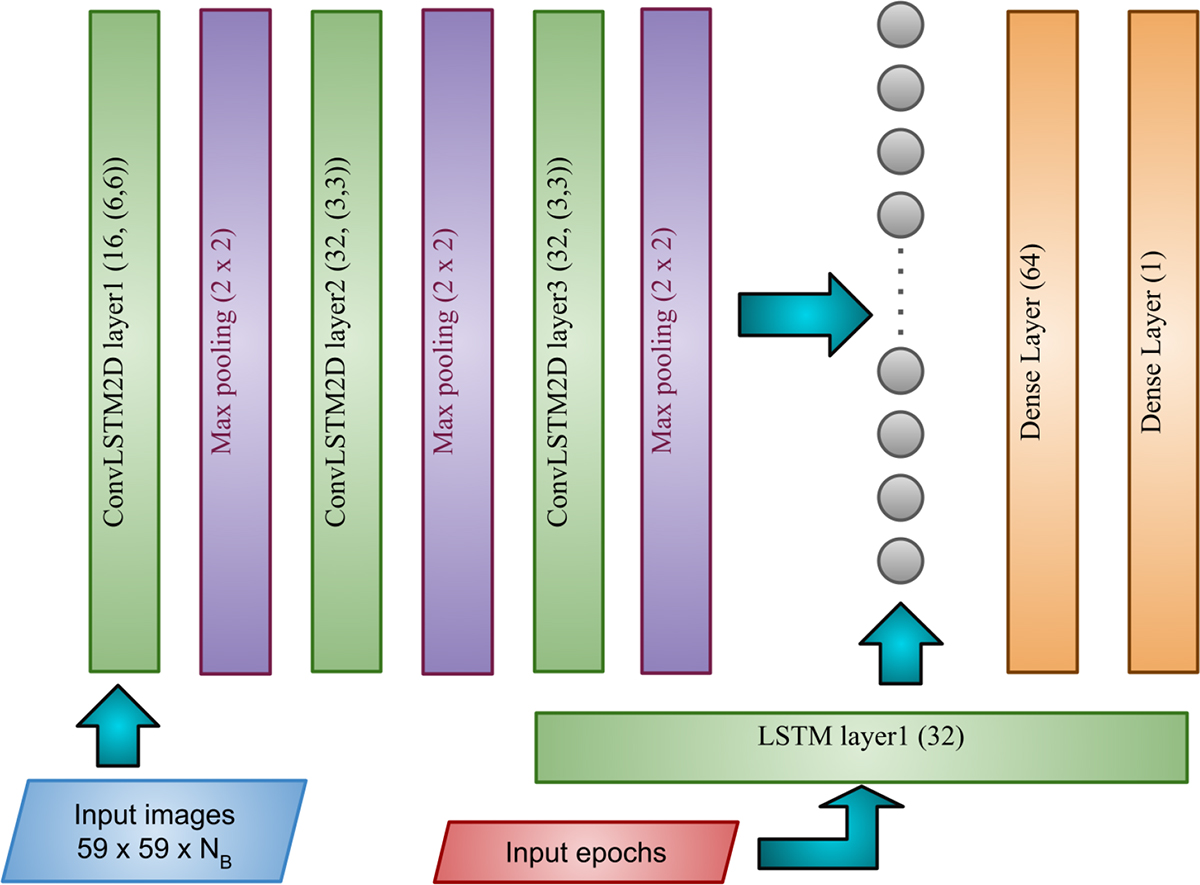
The figure illustrates the architecture of our deep learning model. At each observation epoch, the image cutout is processed through a ConvLSTM2D channel, while the corresponding time value is fed into a standard LSTM channel. The outputs from both channels are then concatenated and passed through a dense layer. The final layer, consisting of a single node with sigmoid activation, outputs a value 𝒫 ∈ (0, 1), representing the probability that the sample is lensed at that particular observation epoch. We use the binary-cross-entropy loss function for binary classification. Note the number of bands is NB = 4 and 1 for the multiband and single-band analyses, respectively.
Current usage metrics show cumulative count of Article Views (full-text article views including HTML views, PDF and ePub downloads, according to the available data) and Abstracts Views on Vision4Press platform.
Data correspond to usage on the plateform after 2015. The current usage metrics is available 48-96 hours after online publication and is updated daily on week days.
Initial download of the metrics may take a while.