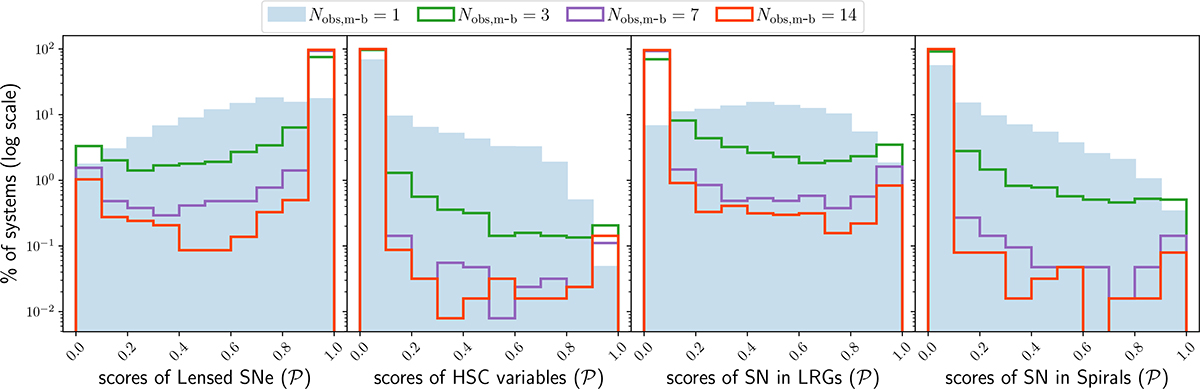
Fig. 7.
Download original image
Distribution of model predicted scores for four different components (LSNe Ia, HSC variables, SNe Ia in LRGs and spiral galaxies) – are plotted in four panels. Each panel shows the distributions obtained after 1st, 3rd, 7th, and 14th epoch of observation (Nobs,m-b). Among the negative components, SNe in LRGs contributes the most to the highest score bin indicates this is responsible for most FPR as indicated explicitly in Fig. 8.
Current usage metrics show cumulative count of Article Views (full-text article views including HTML views, PDF and ePub downloads, according to the available data) and Abstracts Views on Vision4Press platform.
Data correspond to usage on the plateform after 2015. The current usage metrics is available 48-96 hours after online publication and is updated daily on week days.
Initial download of the metrics may take a while.