Fig. 9.
Download original image
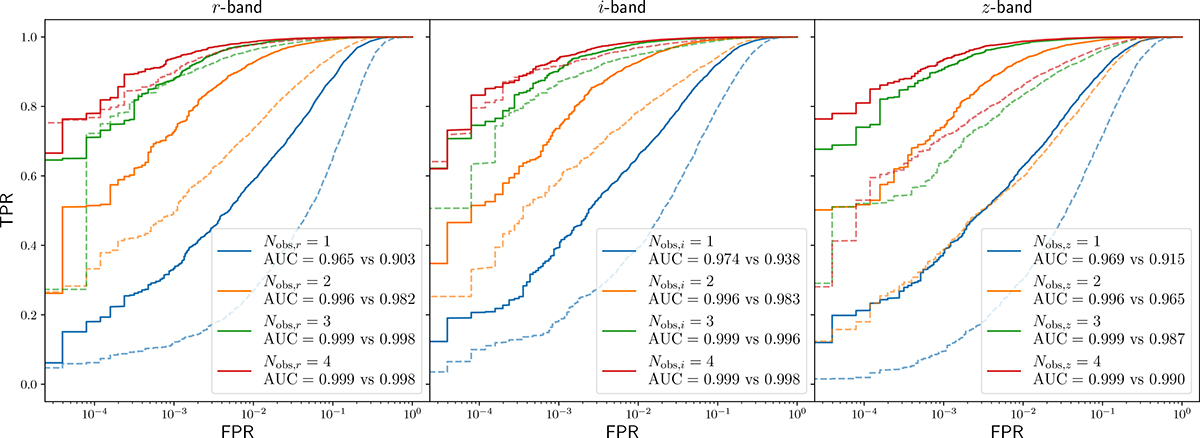
Comparison of classification performance between multiband (solid) and single-band (dashed) analyses using ROC curves for the r, i, and z bands, respectively shown in three panels from the left to right. In each panel, ROC curves corresponding to different observation epochs (Nobs, X where X ∈ {r, i, z}) are shown in different colors. Legends indicate the AUC values for each curve, with multiband listed first, followed by single-band for the same epoch.
Current usage metrics show cumulative count of Article Views (full-text article views including HTML views, PDF and ePub downloads, according to the available data) and Abstracts Views on Vision4Press platform.
Data correspond to usage on the plateform after 2015. The current usage metrics is available 48-96 hours after online publication and is updated daily on week days.
Initial download of the metrics may take a while.