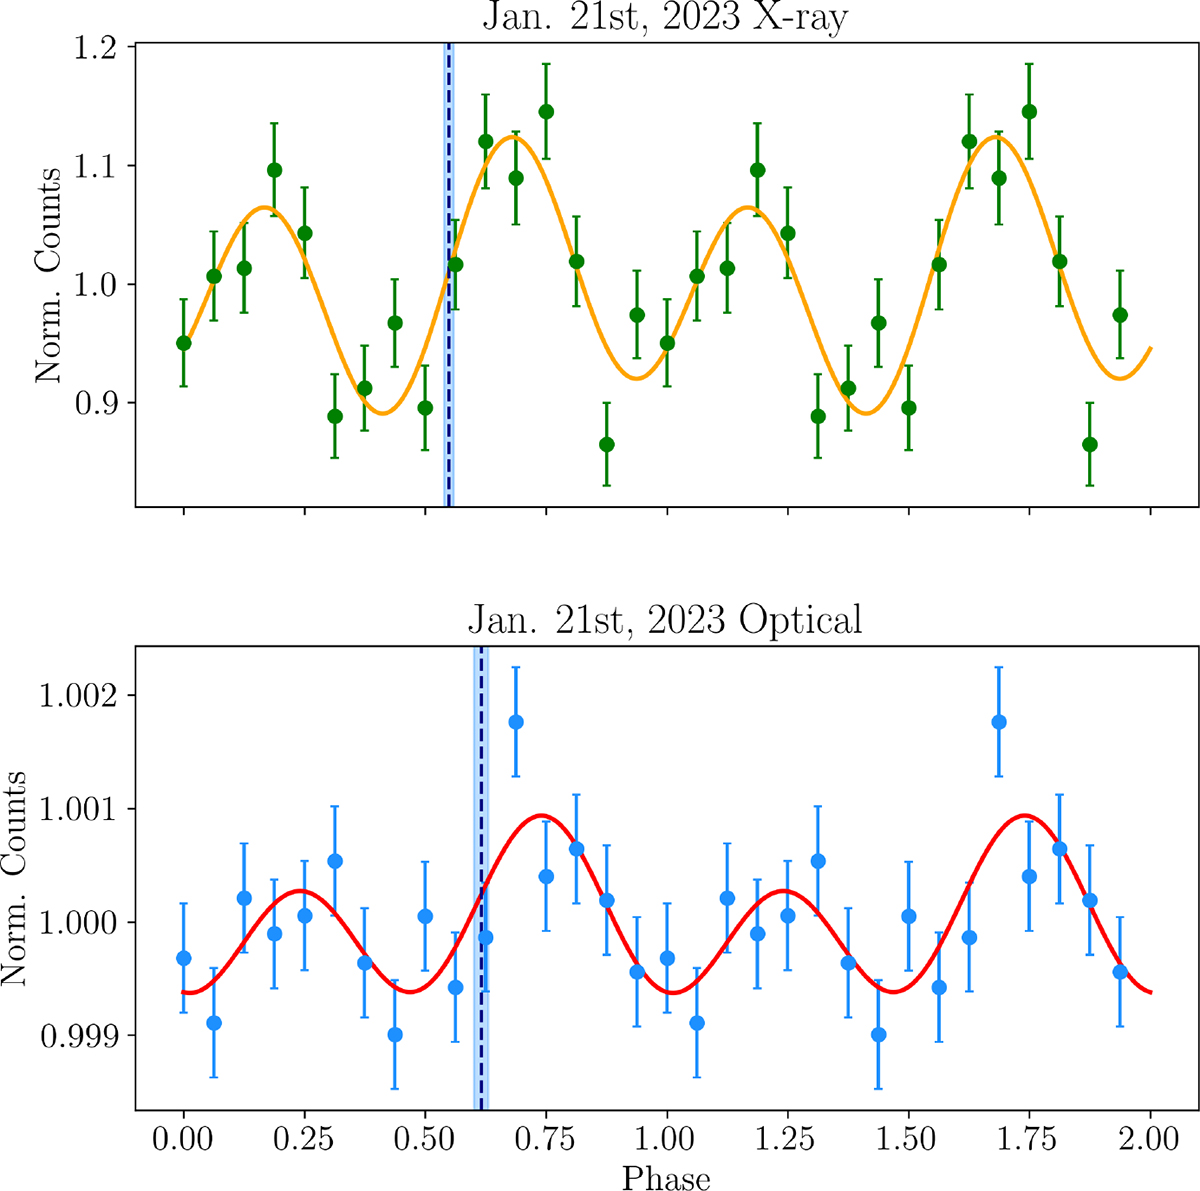
Fig. 4.
Download original image
Pulse profiles of PSR J1023+0038 from January 21, 2023, in the optical (Aqueye+, bottom panel, blue dots) and X-ray (NICER, top panel, green dots) energy bands. Both profiles are fitted with the same model (yellow and red lines; see Eq. 2), folded with the same spin period (see Table 1) and with the same t0 = 59965.0 MJD. The dashed navy lines in both panels represent the phase of the second harmonic (x2), used to measure the phase lag, and the light blue shaded bands indicate the corresponding uncertainties.
Current usage metrics show cumulative count of Article Views (full-text article views including HTML views, PDF and ePub downloads, according to the available data) and Abstracts Views on Vision4Press platform.
Data correspond to usage on the plateform after 2015. The current usage metrics is available 48-96 hours after online publication and is updated daily on week days.
Initial download of the metrics may take a while.