Open Access
Fig. 1.
Download original image
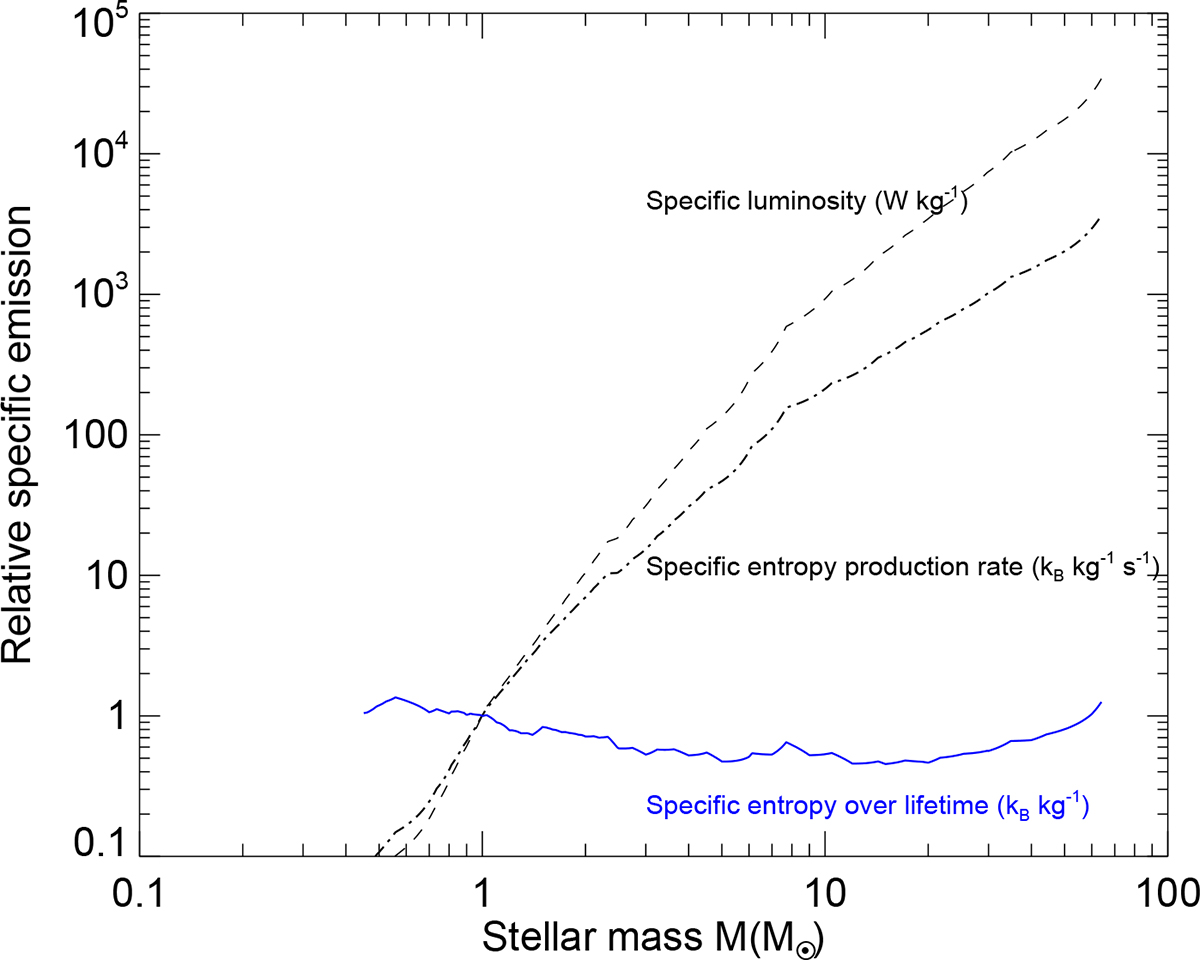
Comparison of specific luminosity (dashed line), specific entropy production (dash-dotted line), and specific entropy production integrated over the lifetime of a star on the MS of the HR diagram (solid blue line) for stars of different masses. All curves are normalized to a value of one at the mass of the Sun.
Current usage metrics show cumulative count of Article Views (full-text article views including HTML views, PDF and ePub downloads, according to the available data) and Abstracts Views on Vision4Press platform.
Data correspond to usage on the plateform after 2015. The current usage metrics is available 48-96 hours after online publication and is updated daily on week days.
Initial download of the metrics may take a while.