Fig. 13
Download original image
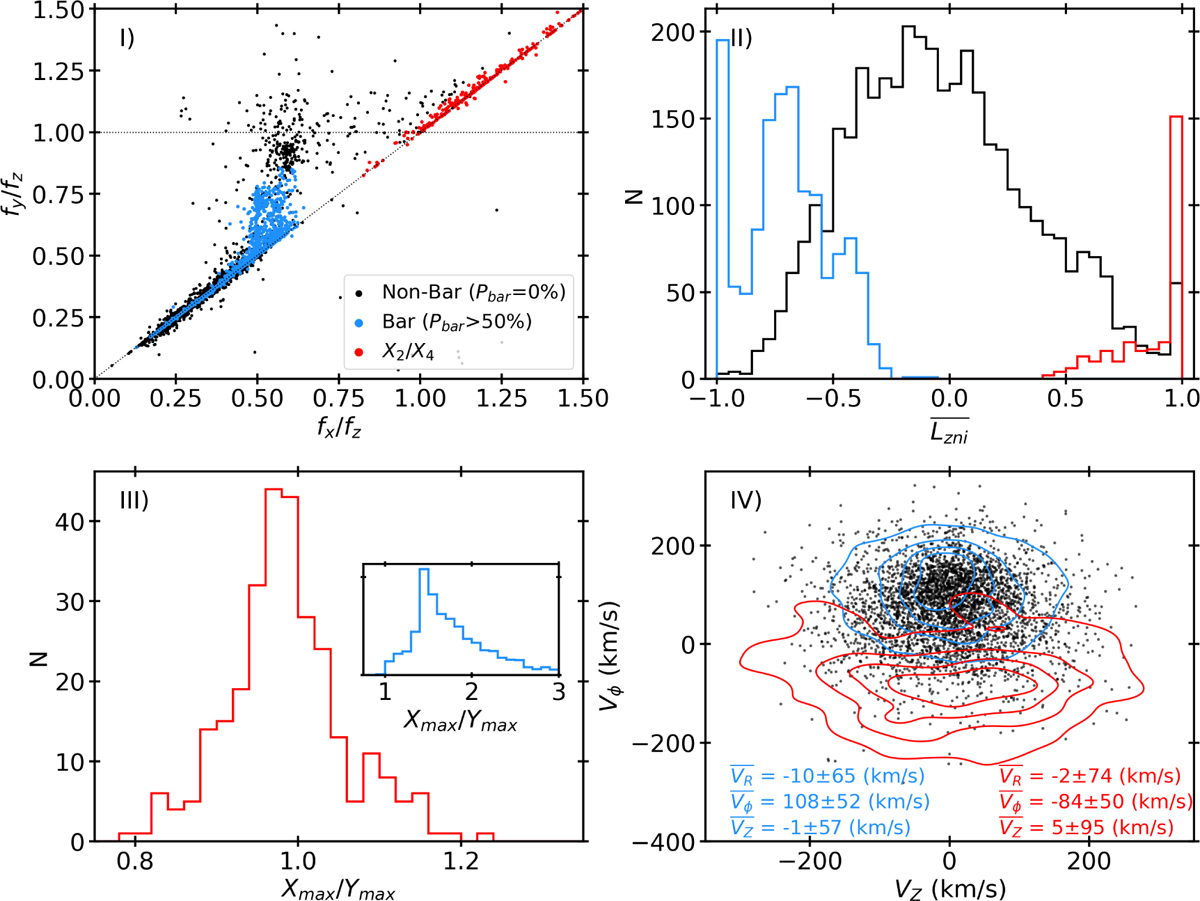
Identification of X4 orbits: (I) frequency map, fy/fz vs fx/fz, showing the bar-supporting stars (blue), the X4 orbits (red), and the non-bar stars (black); (II) distribution of the net angular momentum parameter (Lzni) in the non-inertial reference frame; (III) distribution of the Xmax/Ymax ratio for the X4 orbits. The inset shows the same for the bar stars. (IV) Vφ vs VZ distribution for the X4 and the bar stars shown as contour plots, along with mean velocities, galactocentric velocities, and their respective dispersions. The non-bar stars are shown as black points.
Current usage metrics show cumulative count of Article Views (full-text article views including HTML views, PDF and ePub downloads, according to the available data) and Abstracts Views on Vision4Press platform.
Data correspond to usage on the plateform after 2015. The current usage metrics is available 48-96 hours after online publication and is updated daily on week days.
Initial download of the metrics may take a while.