Fig. 21
Download original image
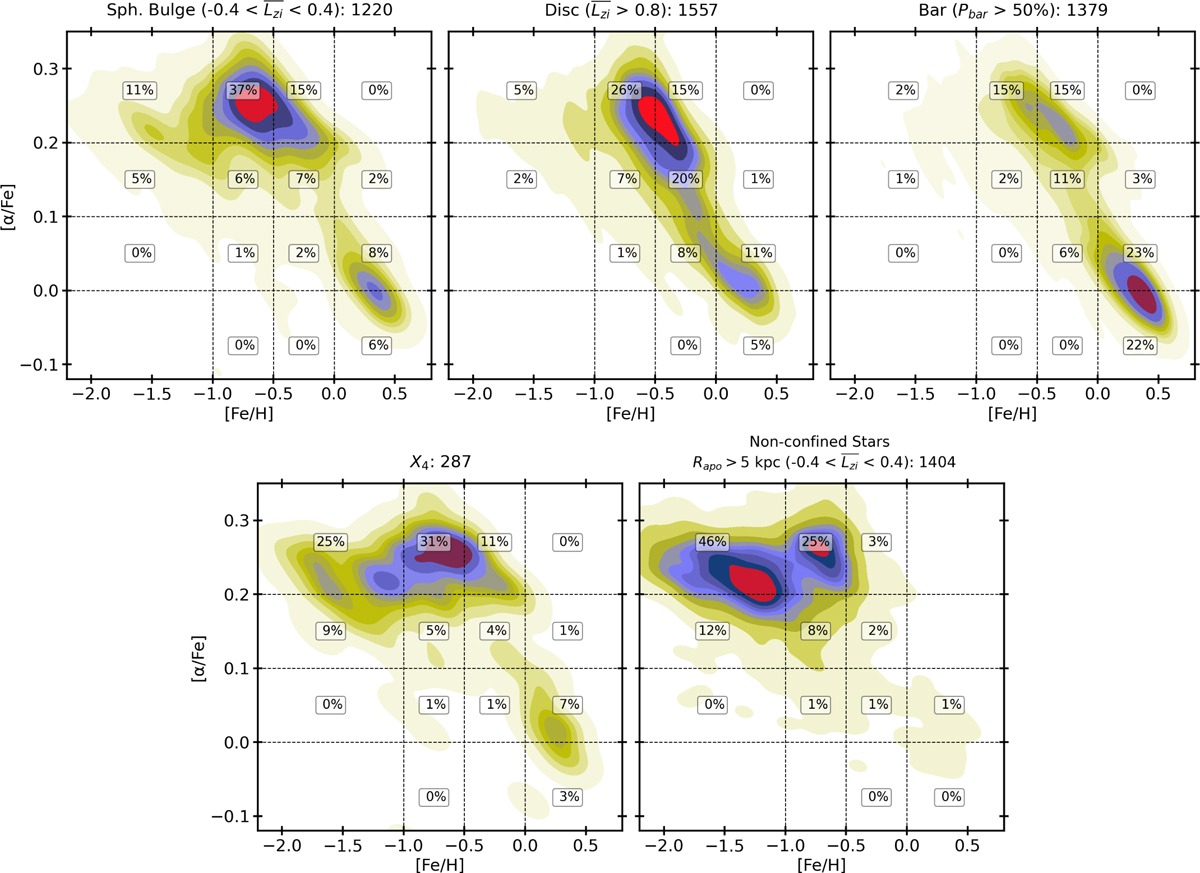
[α/Fe] vs [Fe/H] relation for the spheroidal bulge (top-left), the inner-thick disc (top-middle), the bar (top-right), the X4 orbit family of stars (bottom-left), and the non-confined stars with (−0.4 < Lzi < 0.4) (bottom-right). Each panel shows the KDE - overlaid with contours highlighting regions of high stellar density. Colours indicate density levels, with red being the highest, followed by blue and green, while white indicates regions with no stars. The [α/Fe] vs [Fe/H] plane is further divided into rectangular regions with lines at [Fe/H]=[−1.0,−0.5,0.0] and [α/Fe]=[0.0,0.1,0.2]. The fraction of stars in each region is provided.
Current usage metrics show cumulative count of Article Views (full-text article views including HTML views, PDF and ePub downloads, according to the available data) and Abstracts Views on Vision4Press platform.
Data correspond to usage on the plateform after 2015. The current usage metrics is available 48-96 hours after online publication and is updated daily on week days.
Initial download of the metrics may take a while.