Fig. 7
Download original image
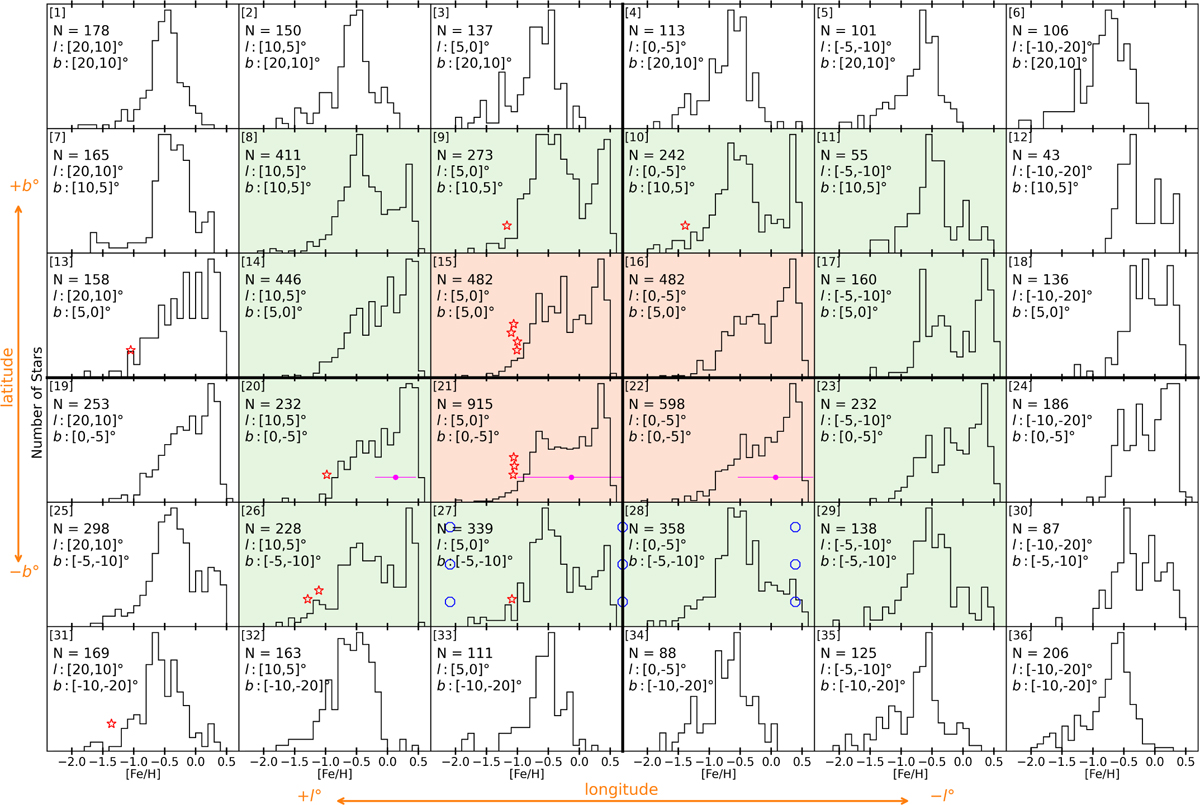
MDF of the combined bulge sample for different longitude-latitude (l, b) bins, in point-of-view of sky distribution (in Galactic coordinates). The thick lines represent the axes for l and b, i.e. 0° lines with positive (+ve) longitude on the left and negative (-ve) on the right, and -ve latitude downwards and +ve upwards. The red panels represent the central 5 degrees, and the green panels represents the central 10 degrees. Each panel shows the respective lb range, number of stars, and the MDF. Red stars, placed according to their on-sky position, show the metallicity for the Bulge GCs from Souza et al. (2024a). Magenta circles show the median [Fe/H]for the micro-lensed dwarf stars from Bensby et al. (2013). The error bars represent the spread of the [Fe/H]in each lb bins. The blue hexagons show the positions of the fields from the study of Lim et al. (2021), using BDBS bulge red-clump stars.
Current usage metrics show cumulative count of Article Views (full-text article views including HTML views, PDF and ePub downloads, according to the available data) and Abstracts Views on Vision4Press platform.
Data correspond to usage on the plateform after 2015. The current usage metrics is available 48-96 hours after online publication and is updated daily on week days.
Initial download of the metrics may take a while.