Fig. 8
Download original image
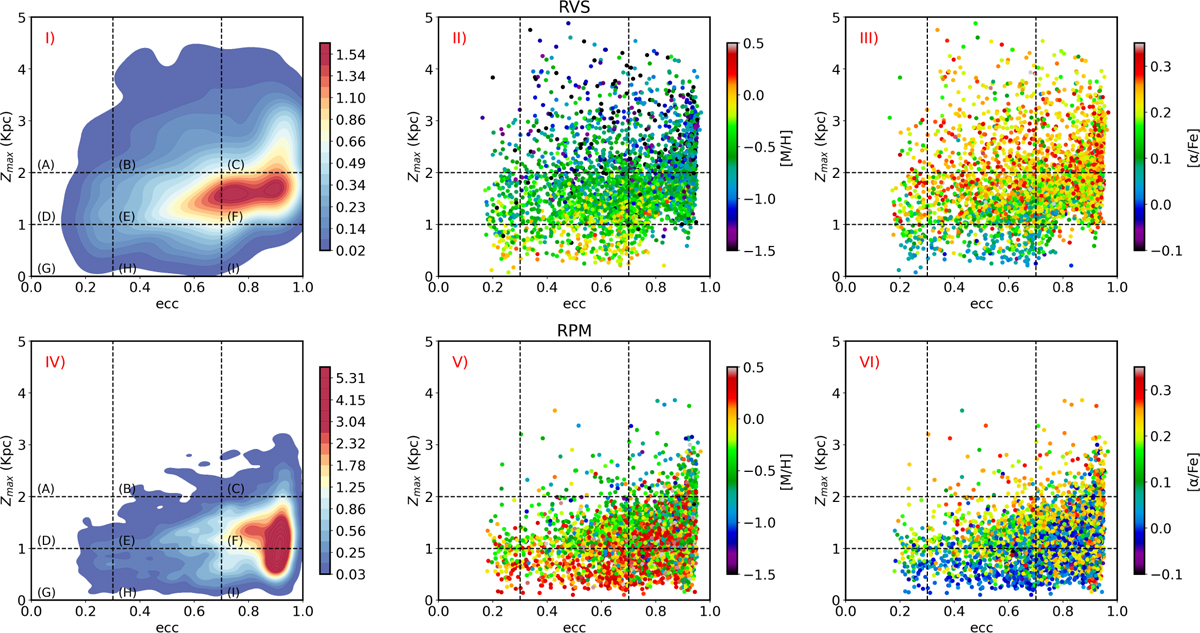
Zmax-eccentricity diagram for the bulge sample (Top row: RVS; Bottom row: RPM). Left (Panels I and IV): kernel density estimate (KDE) plot. The dashed lines divide the plane into nine cells, which are labelled alphabetically from A to I. Middle (Panels II and V): scatter plot colour-coded by individual [Fe/H]. Right (Panels III and VI): scatter plot colour-coded by individual [α/Fe].
Current usage metrics show cumulative count of Article Views (full-text article views including HTML views, PDF and ePub downloads, according to the available data) and Abstracts Views on Vision4Press platform.
Data correspond to usage on the plateform after 2015. The current usage metrics is available 48-96 hours after online publication and is updated daily on week days.
Initial download of the metrics may take a while.