Open Access
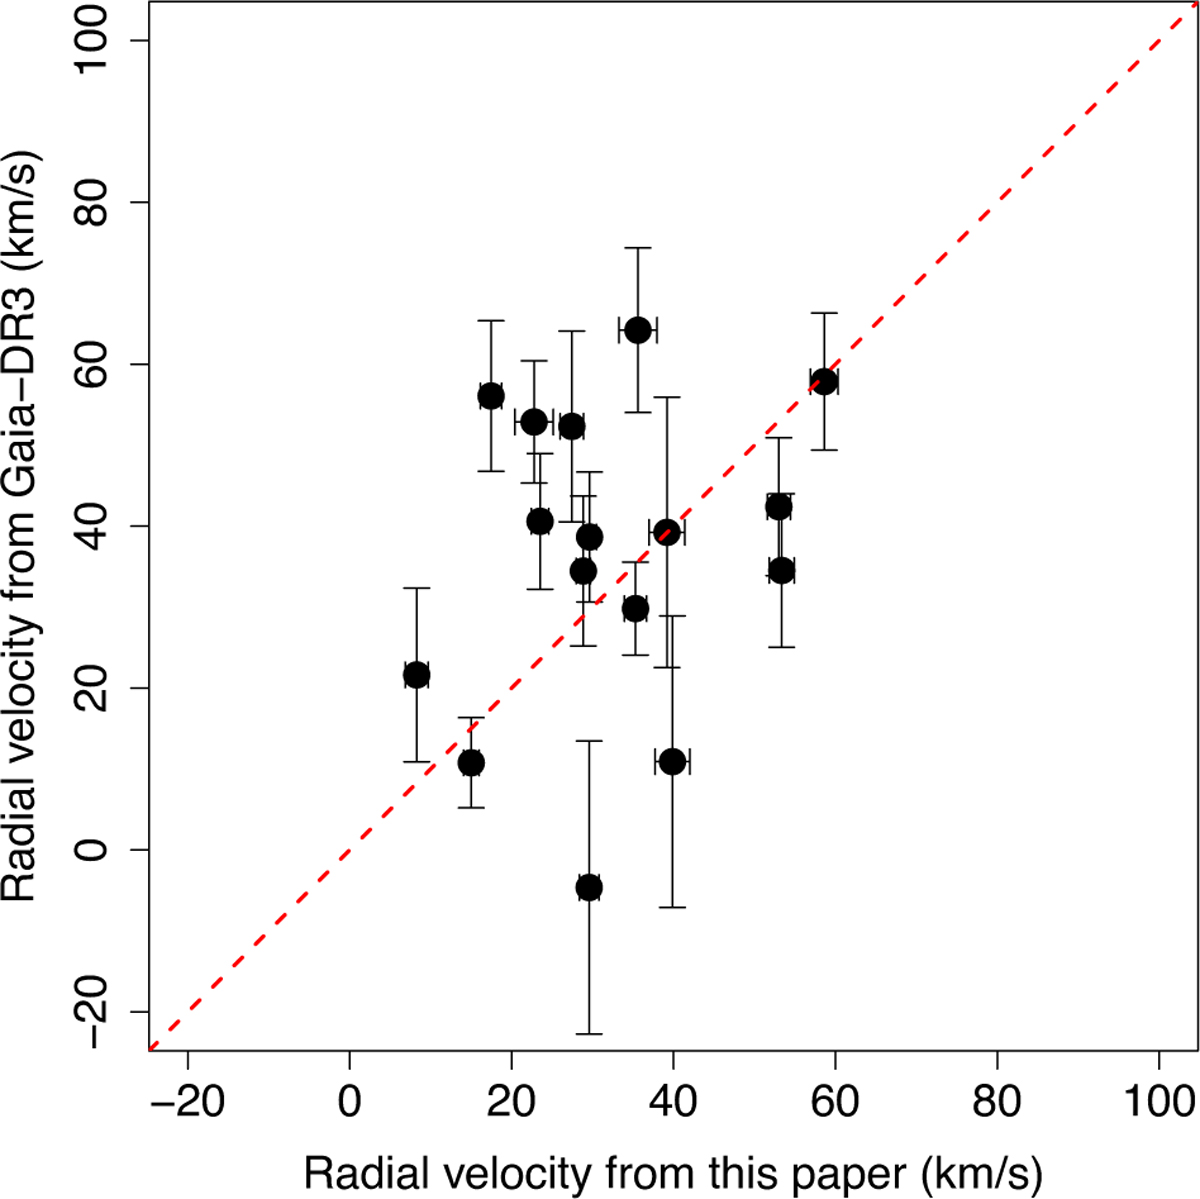
Fig. 5
Download original image
Comparison of radial velocity data obtained from our observations and Gaia DR3 data. One source of our sample (namely Gaia DR3 3046207139539172864) is not shown to improve the visibility of the plot.
Current usage metrics show cumulative count of Article Views (full-text article views including HTML views, PDF and ePub downloads, according to the available data) and Abstracts Views on Vision4Press platform.
Data correspond to usage on the plateform after 2015. The current usage metrics is available 48-96 hours after online publication and is updated daily on week days.
Initial download of the metrics may take a while.