Open Access
Fig. 9
Download original image
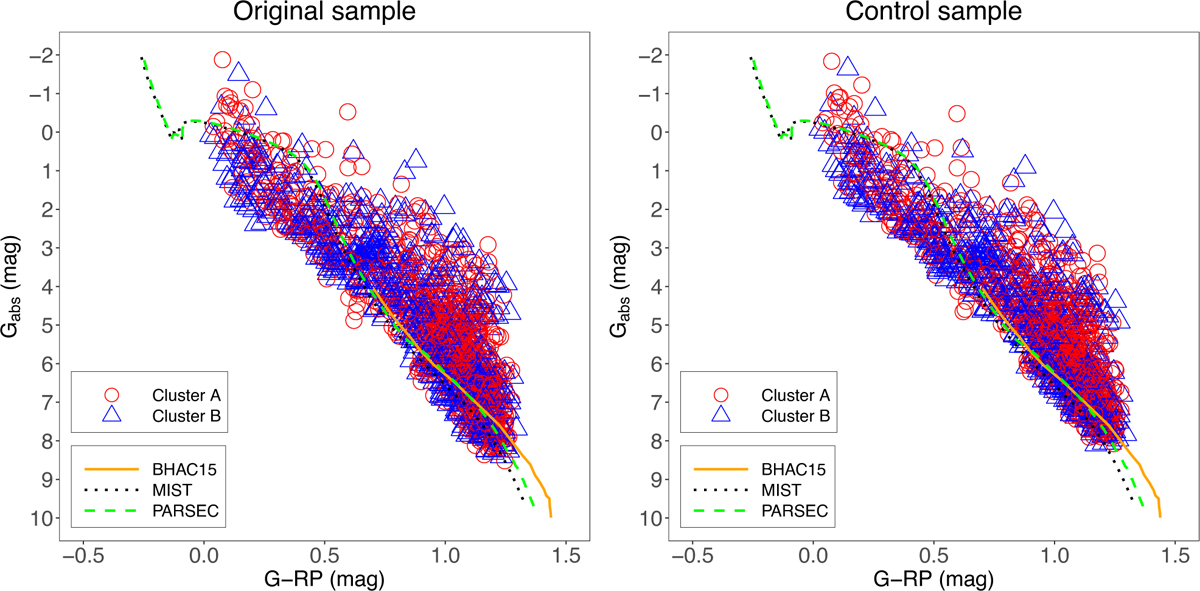
Colour-magnitude diagram of CMa region obtained for our original sample (left panel) and control sample (right panel). The different symbols indicate the two subgroups identified in our analysis, and the lines mark the 2 Myr isochrone obtained from different models.
Current usage metrics show cumulative count of Article Views (full-text article views including HTML views, PDF and ePub downloads, according to the available data) and Abstracts Views on Vision4Press platform.
Data correspond to usage on the plateform after 2015. The current usage metrics is available 48-96 hours after online publication and is updated daily on week days.
Initial download of the metrics may take a while.