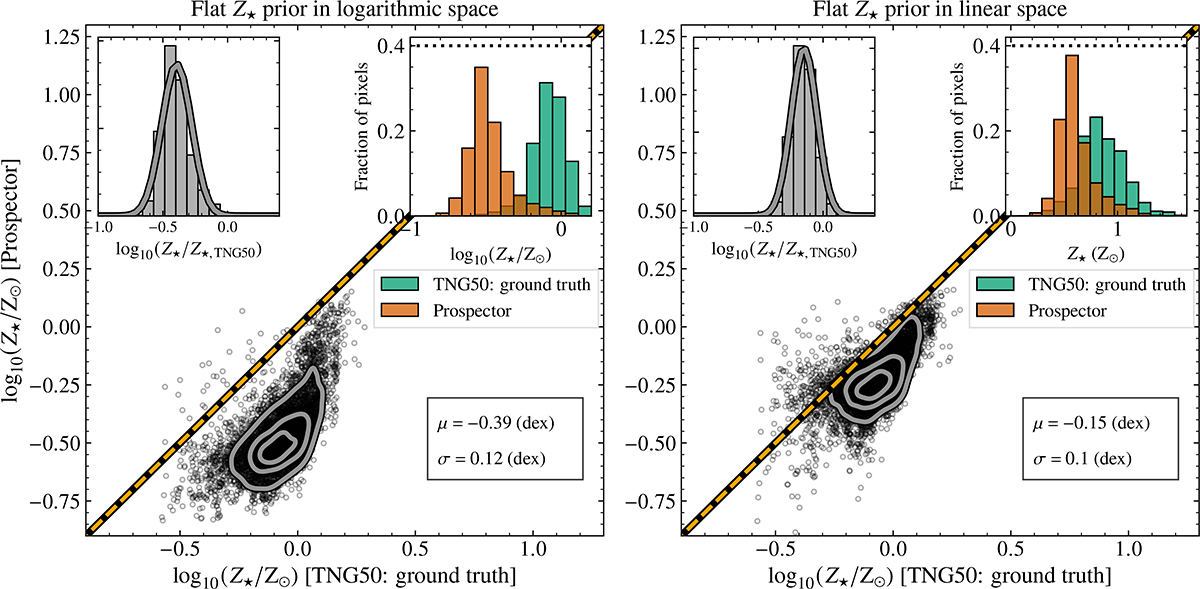
Fig. A.1.
Download original image
Comparison of the spatially resolved stellar metallicities for 6958 pixel bins in the 25 sample galaxies measured by different prior functions. The true values of Z★ (x-axis) are compared with those from our fiducial run (y-axis), when a flat prior for Z★ is used in logarithmic space (left panel) and in linear space (right panel). The dashed orange line shows the one-to-one relation, while contours enclose 20%, 50%, and 80% of the total data. Top-left: Residual distribution, log10(Z★/Z★, TNG50). Top-right: Comparison of the true Z★ values (teal distribution) with those recovered from Prospector (orange distribution). The dotted lines correspond to the prior probability distributions, scaled with an arbitrary factor. The mean offset (μ) and scatter (σ) between the two distributions are indicated in each panel. A flat prior in linear space for Z★ returns values closer to the ground truth.
Current usage metrics show cumulative count of Article Views (full-text article views including HTML views, PDF and ePub downloads, according to the available data) and Abstracts Views on Vision4Press platform.
Data correspond to usage on the plateform after 2015. The current usage metrics is available 48-96 hours after online publication and is updated daily on week days.
Initial download of the metrics may take a while.