Fig. B.1.
Download original image
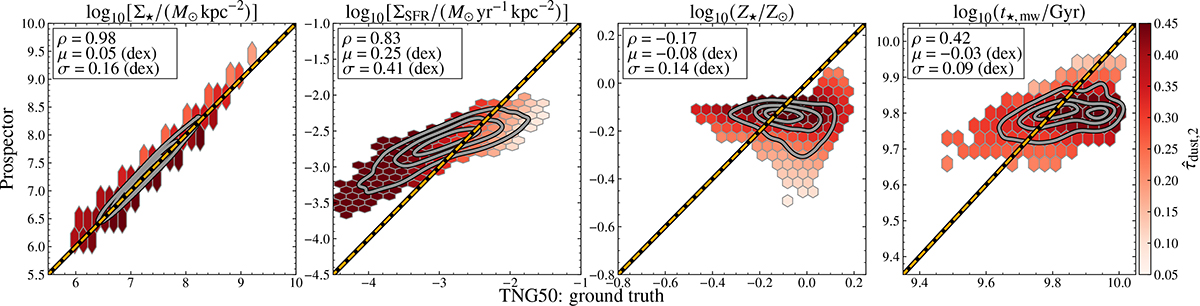
Comparisons of the spatially resolved stellar population properties derived from spatially resolved SED fitting with a nonparametric SFH model on seven broadbands. The photometric bands used in this analysis include the GALEX FUV and NUV, and LSST u, g, r, i, and z, in the resolution of GALEX. From left to right, we show the pixel values of the stellar property maps, that is Σ★, ΣSFR, Z★, and t★, mw. Points are color-coded according to the average trend of the dust optical depth in the V band (![]() ), calculated with the LOESS method. Contours enclose 20%, 50%, and 80% of the total data. The dashed orange line shows the one-to-one relation. The Spearman’s correlation coefficient (ρ), measured bias (average offset μ), and scatter (standard deviation σ) relative to the ground truth from TNG50 are indicated in the legend of each panel.
), calculated with the LOESS method. Contours enclose 20%, 50%, and 80% of the total data. The dashed orange line shows the one-to-one relation. The Spearman’s correlation coefficient (ρ), measured bias (average offset μ), and scatter (standard deviation σ) relative to the ground truth from TNG50 are indicated in the legend of each panel.
Current usage metrics show cumulative count of Article Views (full-text article views including HTML views, PDF and ePub downloads, according to the available data) and Abstracts Views on Vision4Press platform.
Data correspond to usage on the plateform after 2015. The current usage metrics is available 48-96 hours after online publication and is updated daily on week days.
Initial download of the metrics may take a while.