Fig. 6.
Download original image
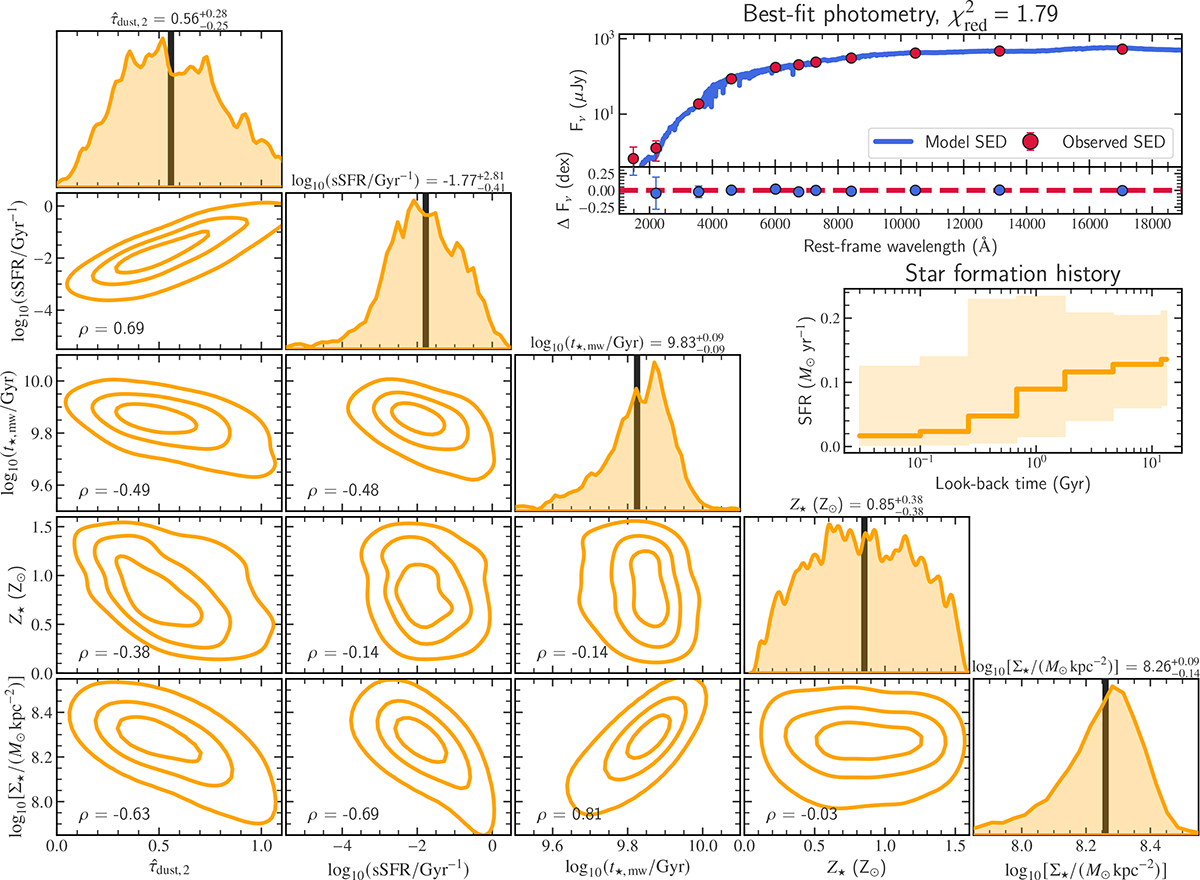
Joint posterior distributions of the main physical properties in our analysis, the best-fit SED, and the recovered SFH for a selected pixel bin of TNG414917 with the O4 orientation index. The corner plot displays the posterior distributions of ![]() , sSFR, t★, mw, Z★, and Σ★. Contours enclose the 20%, 50%, and 80% of the total data, while the vertical dashed black lines mark the median values for each parameter. The median and the 16th–84th percentile range for each physical property are given at the top of the corresponding posterior distribution. The Spearman’s correlation coefficient, ρ, quantifies the strength of correlation between two posterior distributions. Top right: Comparison of the input photometric data (red points) to the best-fit SED model (blue line). Bottom right: Subpanel illustrating the absolute residuals defined as ΔFν = log10(fit/ground truth). The photometric uncertainties are not visible in the plot because they are smaller than the symbol size. Bottom: Posterior distribution of the SFH.
, sSFR, t★, mw, Z★, and Σ★. Contours enclose the 20%, 50%, and 80% of the total data, while the vertical dashed black lines mark the median values for each parameter. The median and the 16th–84th percentile range for each physical property are given at the top of the corresponding posterior distribution. The Spearman’s correlation coefficient, ρ, quantifies the strength of correlation between two posterior distributions. Top right: Comparison of the input photometric data (red points) to the best-fit SED model (blue line). Bottom right: Subpanel illustrating the absolute residuals defined as ΔFν = log10(fit/ground truth). The photometric uncertainties are not visible in the plot because they are smaller than the symbol size. Bottom: Posterior distribution of the SFH.
Current usage metrics show cumulative count of Article Views (full-text article views including HTML views, PDF and ePub downloads, according to the available data) and Abstracts Views on Vision4Press platform.
Data correspond to usage on the plateform after 2015. The current usage metrics is available 48-96 hours after online publication and is updated daily on week days.
Initial download of the metrics may take a while.