Fig. 8.
Download original image
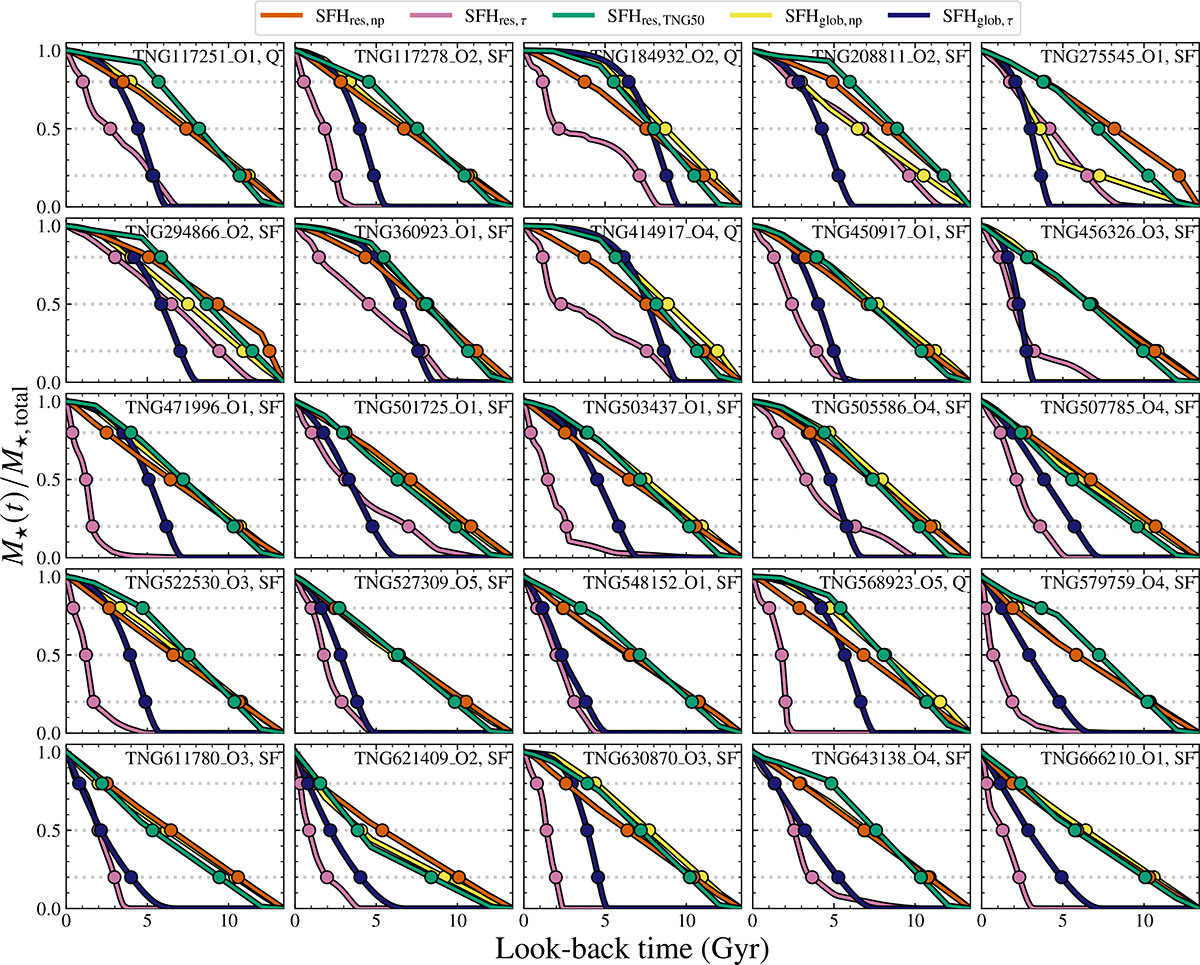
Comparison of the normalized cumulative stellar mass growth curves of all 25 galaxies in our sample. We plot the cumulative stellar mass growth curves from the global nonparametric SFH inferred from our fiducial spatially resolved run (SFHres, np; orange), the global parametric SFH inferred from the spatially resolved map (SFHres, τ; pink), the nonparametric SFH derived from fitting the integrated photometry (SFHglob, np; yellow), the global parametric SFH based on a simple τ-model (SFHglob, τ; blue), and the true global SFH from the TNG50 resolved map (SFHres, TNG50; green). The dotted lines indicate the different formation times by which 20%, 50%, and 80% of a galaxy’s stellar mass was formed. Both nonparametric SFHs (SFHres, np and SFHglob, np) seem to be in better agreement with SFHres, TNG50, while most of the parametric SFHs (both SFHres, τ and SFHglob, τ) are skewed toward a later cosmic time, thus lacking the contribution from the older stellar populations.
Current usage metrics show cumulative count of Article Views (full-text article views including HTML views, PDF and ePub downloads, according to the available data) and Abstracts Views on Vision4Press platform.
Data correspond to usage on the plateform after 2015. The current usage metrics is available 48-96 hours after online publication and is updated daily on week days.
Initial download of the metrics may take a while.