Fig. 9.
Download original image
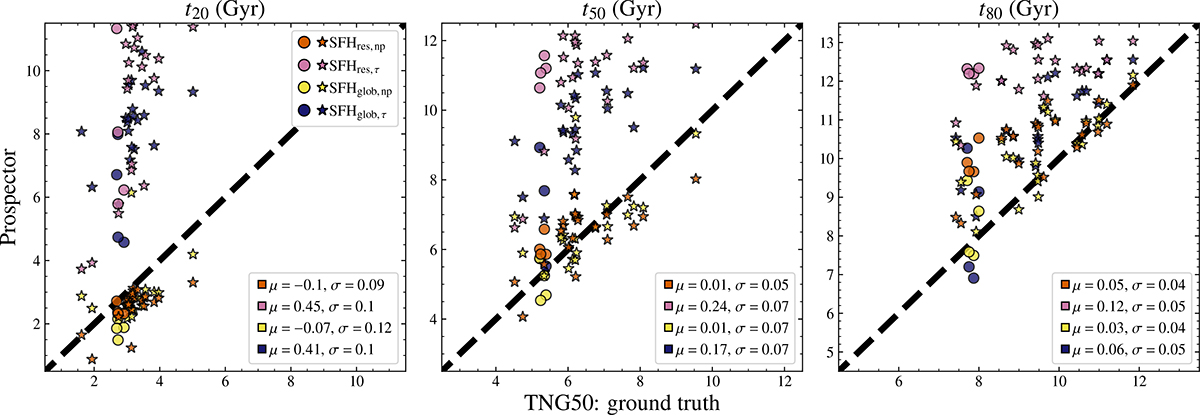
Comparison of the formation timescales for the four different SFH models with respect to the ground truth values from the TNG50 simulation. Each marker represents the formation time of a galaxy in our sample, color-coded according to the corresponding SFH model. Star-forming galaxies are indicated with stars, while quiescent galaxies with points. From left to right: Time for 20% (t20), 50% (t50), and 80% (t80) of a galaxy’s stellar mass formation. The four models include the spatially resolved model from pixel-by-pixel SED fitting with a nonparametric (orange) and parametric (pink) SFH, the integrated SED fitting with a nonparametric SFH (yellow), and a simple τ model within Prospector (blue). The measured bias (average offset μ) and scatter (standard deviation σ) relative to the ground truth from TNG50 are indicated in the legends of the panels. The formation times inferred from the spatially resolved and integrated nonparametric SFHs are in best agreement with the ground truth values.
Current usage metrics show cumulative count of Article Views (full-text article views including HTML views, PDF and ePub downloads, according to the available data) and Abstracts Views on Vision4Press platform.
Data correspond to usage on the plateform after 2015. The current usage metrics is available 48-96 hours after online publication and is updated daily on week days.
Initial download of the metrics may take a while.