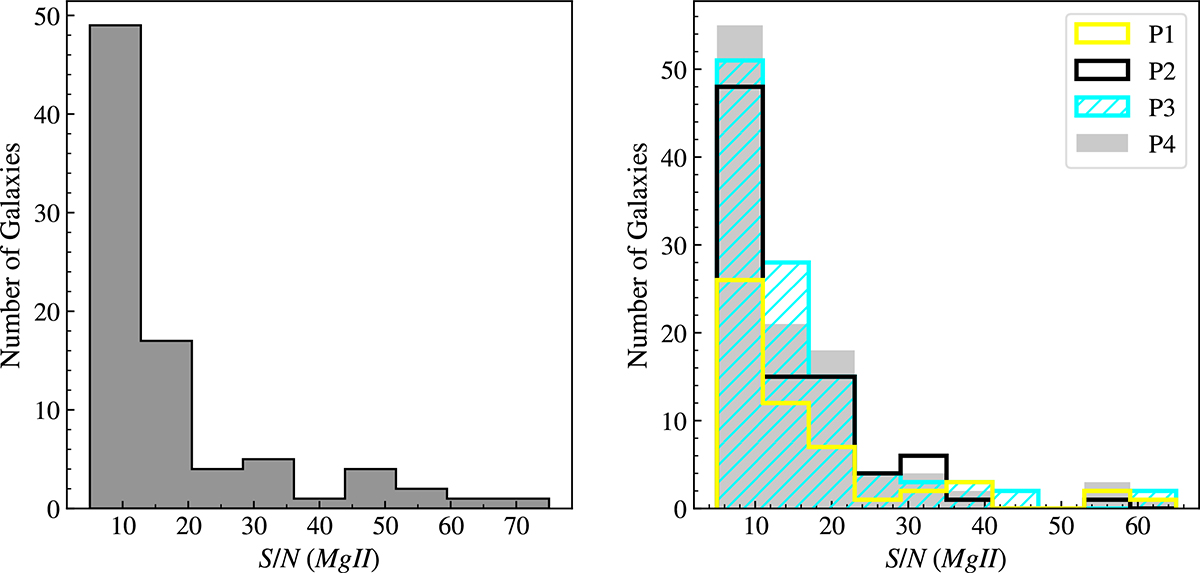
Fig. 1.
Download original image
Distribution of the continuum S/N for the MUSE spectra of the 84 galaxies included in the down-the-barrel subsample (left panel) and of the 360 galaxies used for the transverse analysis, divided into bins of impact parameter: b ≤ 40 kpc (P1), 40 kpc < b ≤ 65 kpc (P2), 65 kpc < b ≤ 90 kpc (P3), and 90 kpc < b ≤ 110 kpc (P4; right panel).
Current usage metrics show cumulative count of Article Views (full-text article views including HTML views, PDF and ePub downloads, according to the available data) and Abstracts Views on Vision4Press platform.
Data correspond to usage on the plateform after 2015. The current usage metrics is available 48-96 hours after online publication and is updated daily on week days.
Initial download of the metrics may take a while.