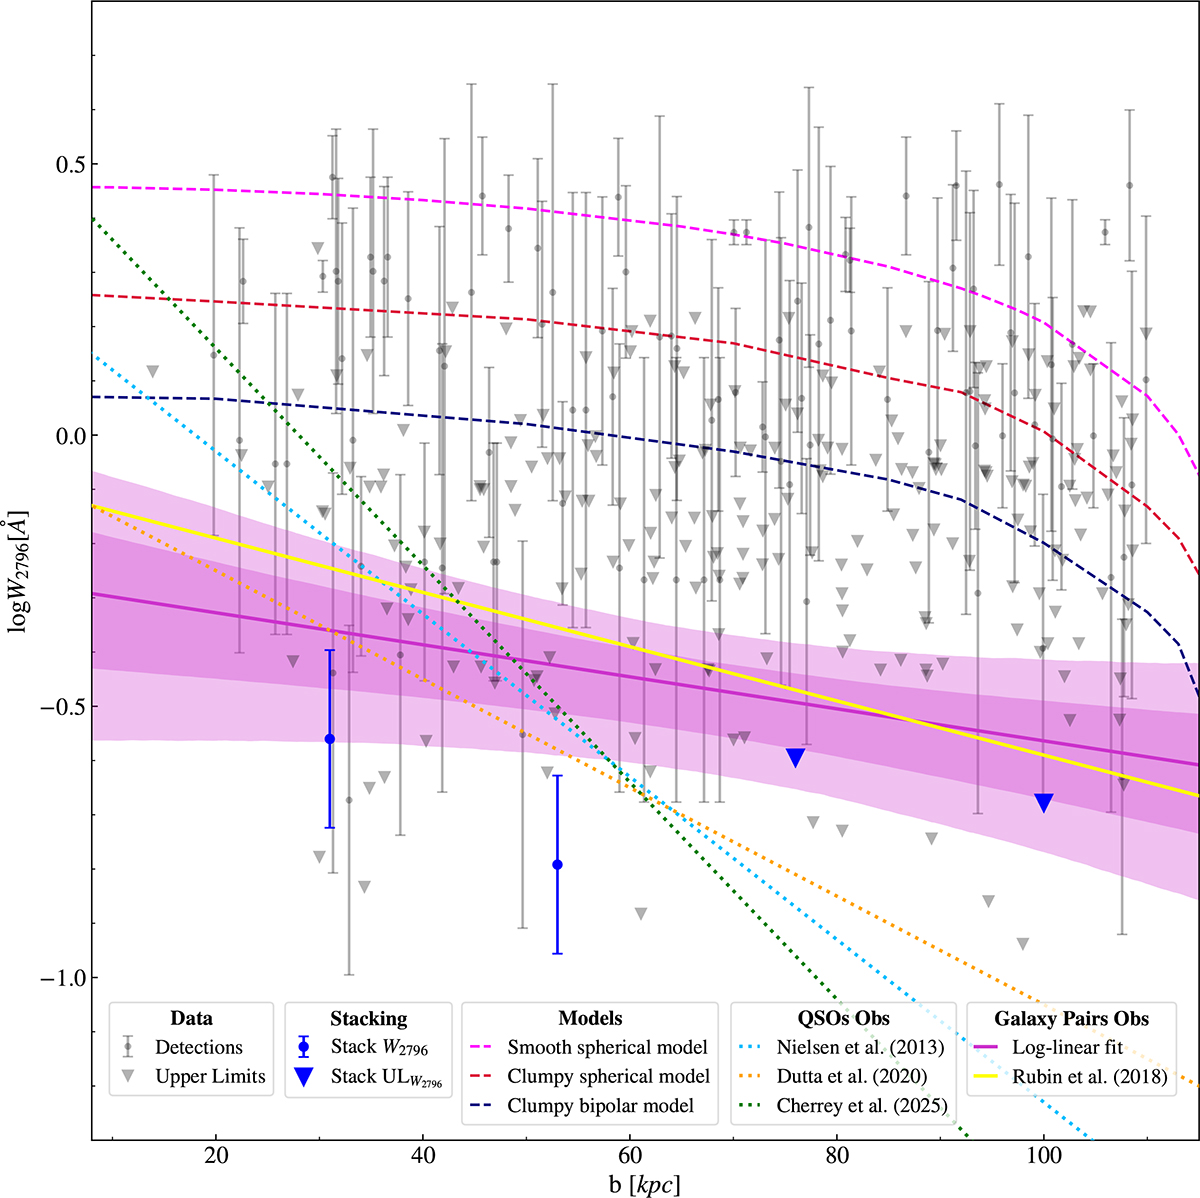
Fig. 10.
Download original image
Relation of EW (W2796) vs. impact parameter (b). Measurements and upper limits (2σ) from individual pairs of f/g and b/g galaxies are plotted as grey dots and triangles, respectively. The solid purple line shows the best-fitting log-linear relation. The shaded regions indicate the 1σ and 2σ bands. The blue dots and triangles represent the detections and upper limits resulting from the stack in impact parameter bins. Various best-fit models from the literature are plotted (Nielsen et al. 2013a; Rubin et al. 2018; Dutta et al. 2020; Cherrey et al. 2025). The dashed lines represent variations in the radiative transfer model prediction for W2796, normalized with the down-the-barrel observations and extrapolated to the halo.
Current usage metrics show cumulative count of Article Views (full-text article views including HTML views, PDF and ePub downloads, according to the available data) and Abstracts Views on Vision4Press platform.
Data correspond to usage on the plateform after 2015. The current usage metrics is available 48-96 hours after online publication and is updated daily on week days.
Initial download of the metrics may take a while.