Open Access
Fig. 6.
Download original image
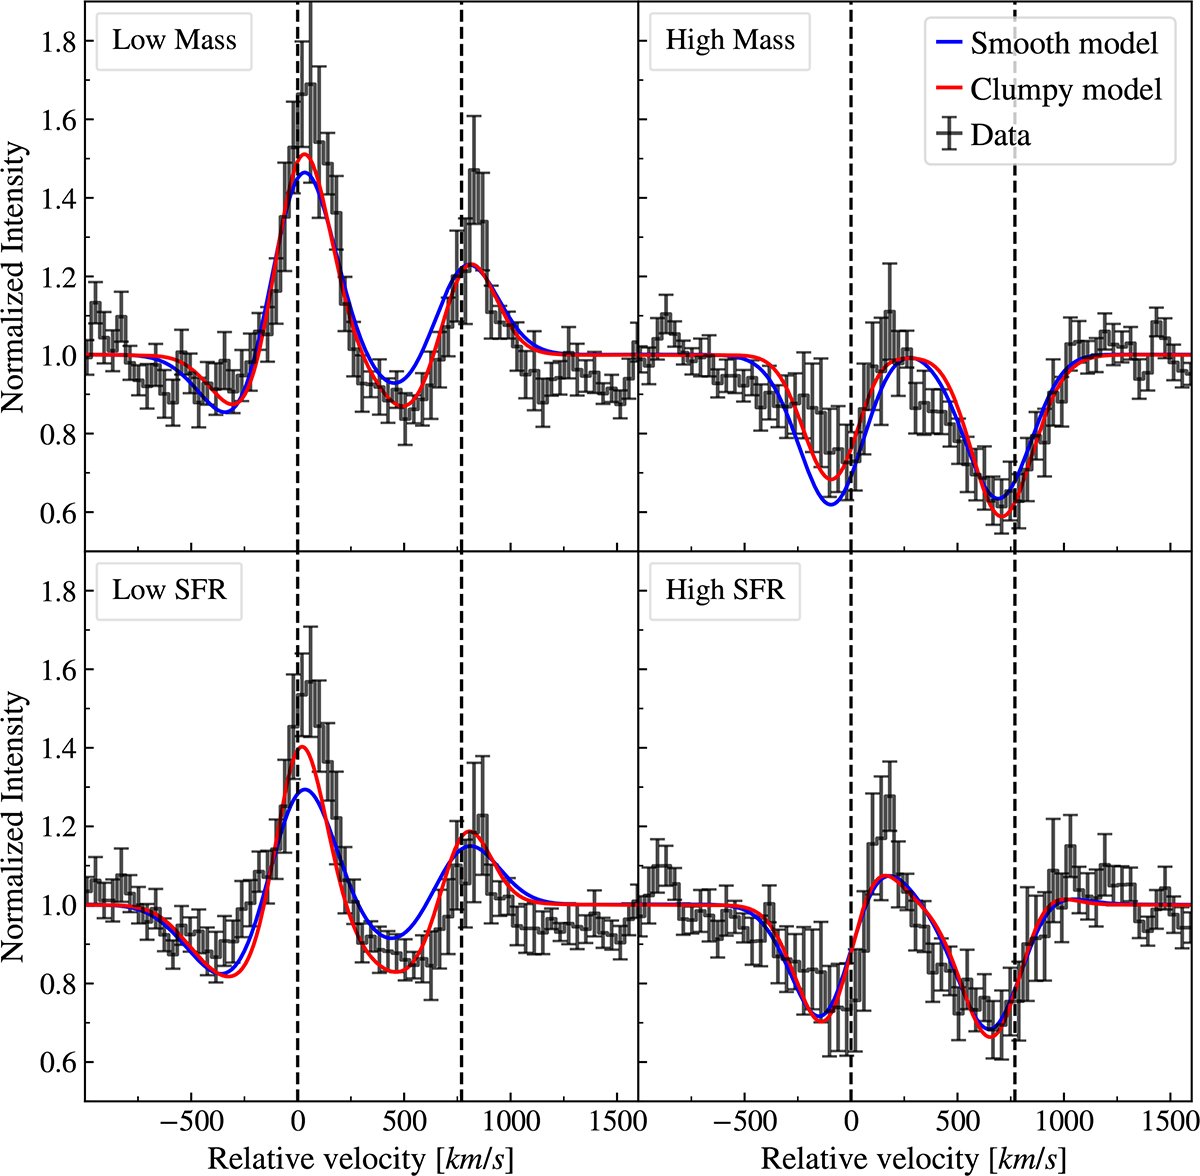
Mg II down-the-barrel stacked spectra (gray data points) and best-fit simulated spectra from RT-scat for the different mass (upper panels) and SFR (lower panels) bins, assuming the gas as a smooth medium (blue lines) and as a clumpy medium (red lines).
Current usage metrics show cumulative count of Article Views (full-text article views including HTML views, PDF and ePub downloads, according to the available data) and Abstracts Views on Vision4Press platform.
Data correspond to usage on the plateform after 2015. The current usage metrics is available 48-96 hours after online publication and is updated daily on week days.
Initial download of the metrics may take a while.