Fig. 8.
Download original image
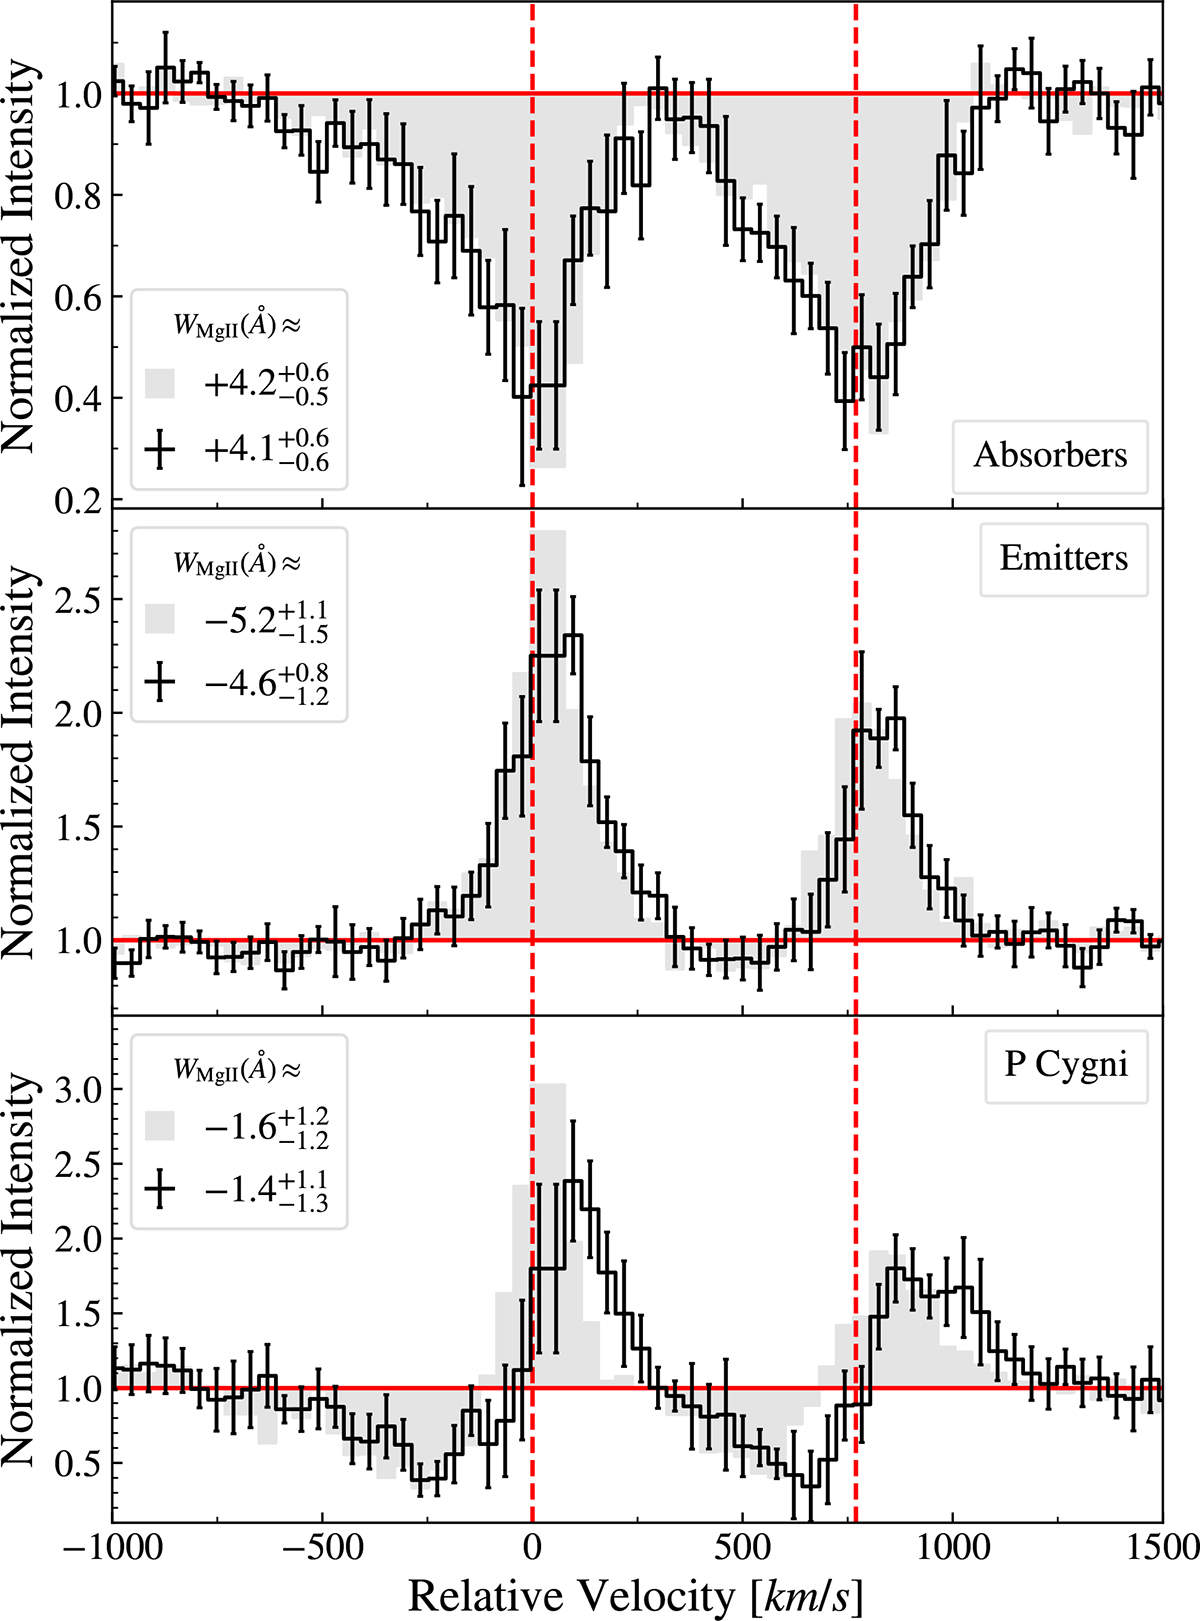
Stack of spectra with detected Mg II absorption (top panel), emission (middle panel), and P-Cygni (bottom panel) profiles. The black lines represent the stack of all the galaxies of each class relative to the systemic redshift inferred from other ISM lines. The filled gray spectra instead refer to stacks on the minimum of the K line for the absorption sample and the maximum for the emission for the emitters and the P-Cygni samples.
Current usage metrics show cumulative count of Article Views (full-text article views including HTML views, PDF and ePub downloads, according to the available data) and Abstracts Views on Vision4Press platform.
Data correspond to usage on the plateform after 2015. The current usage metrics is available 48-96 hours after online publication and is updated daily on week days.
Initial download of the metrics may take a while.