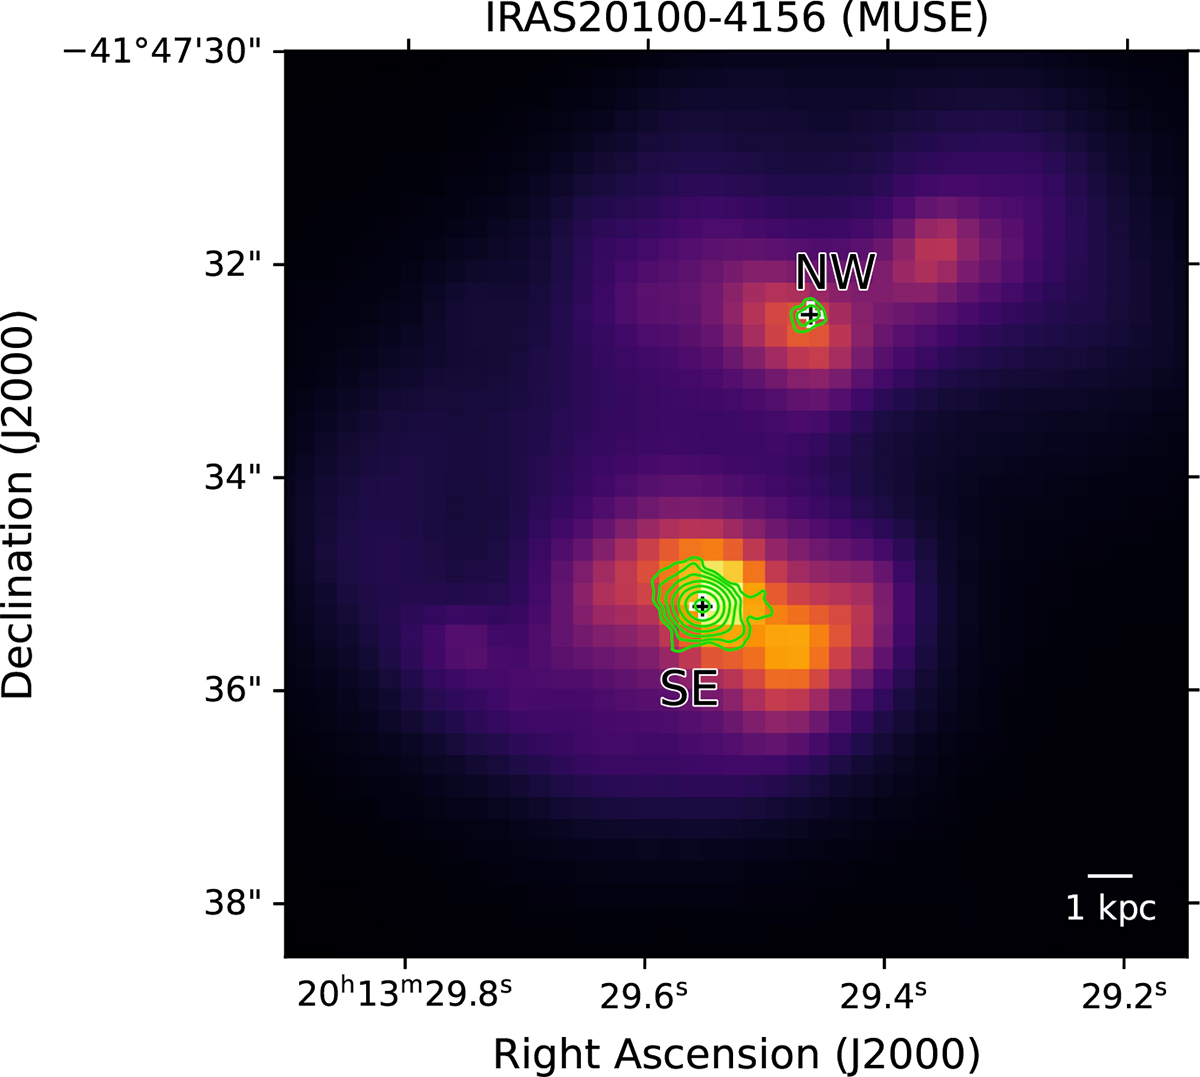
Fig. 1.
Download original image
Integrated intensity map of IRAS20100-4156 produced from the MUSE cube. The black-and-white crosses show the positions of the two main merger components determined from the high-resolution ALMA observations of CO(3-2), while the green contours show the zeroth moment of the same CO(3-2) data. The first two contour levels correspond to three and five times the noise level of the moment map, respectively, and every following step is doubled.
Current usage metrics show cumulative count of Article Views (full-text article views including HTML views, PDF and ePub downloads, according to the available data) and Abstracts Views on Vision4Press platform.
Data correspond to usage on the plateform after 2015. The current usage metrics is available 48-96 hours after online publication and is updated daily on week days.
Initial download of the metrics may take a while.