Open Access
Fig. A.1.
Download original image
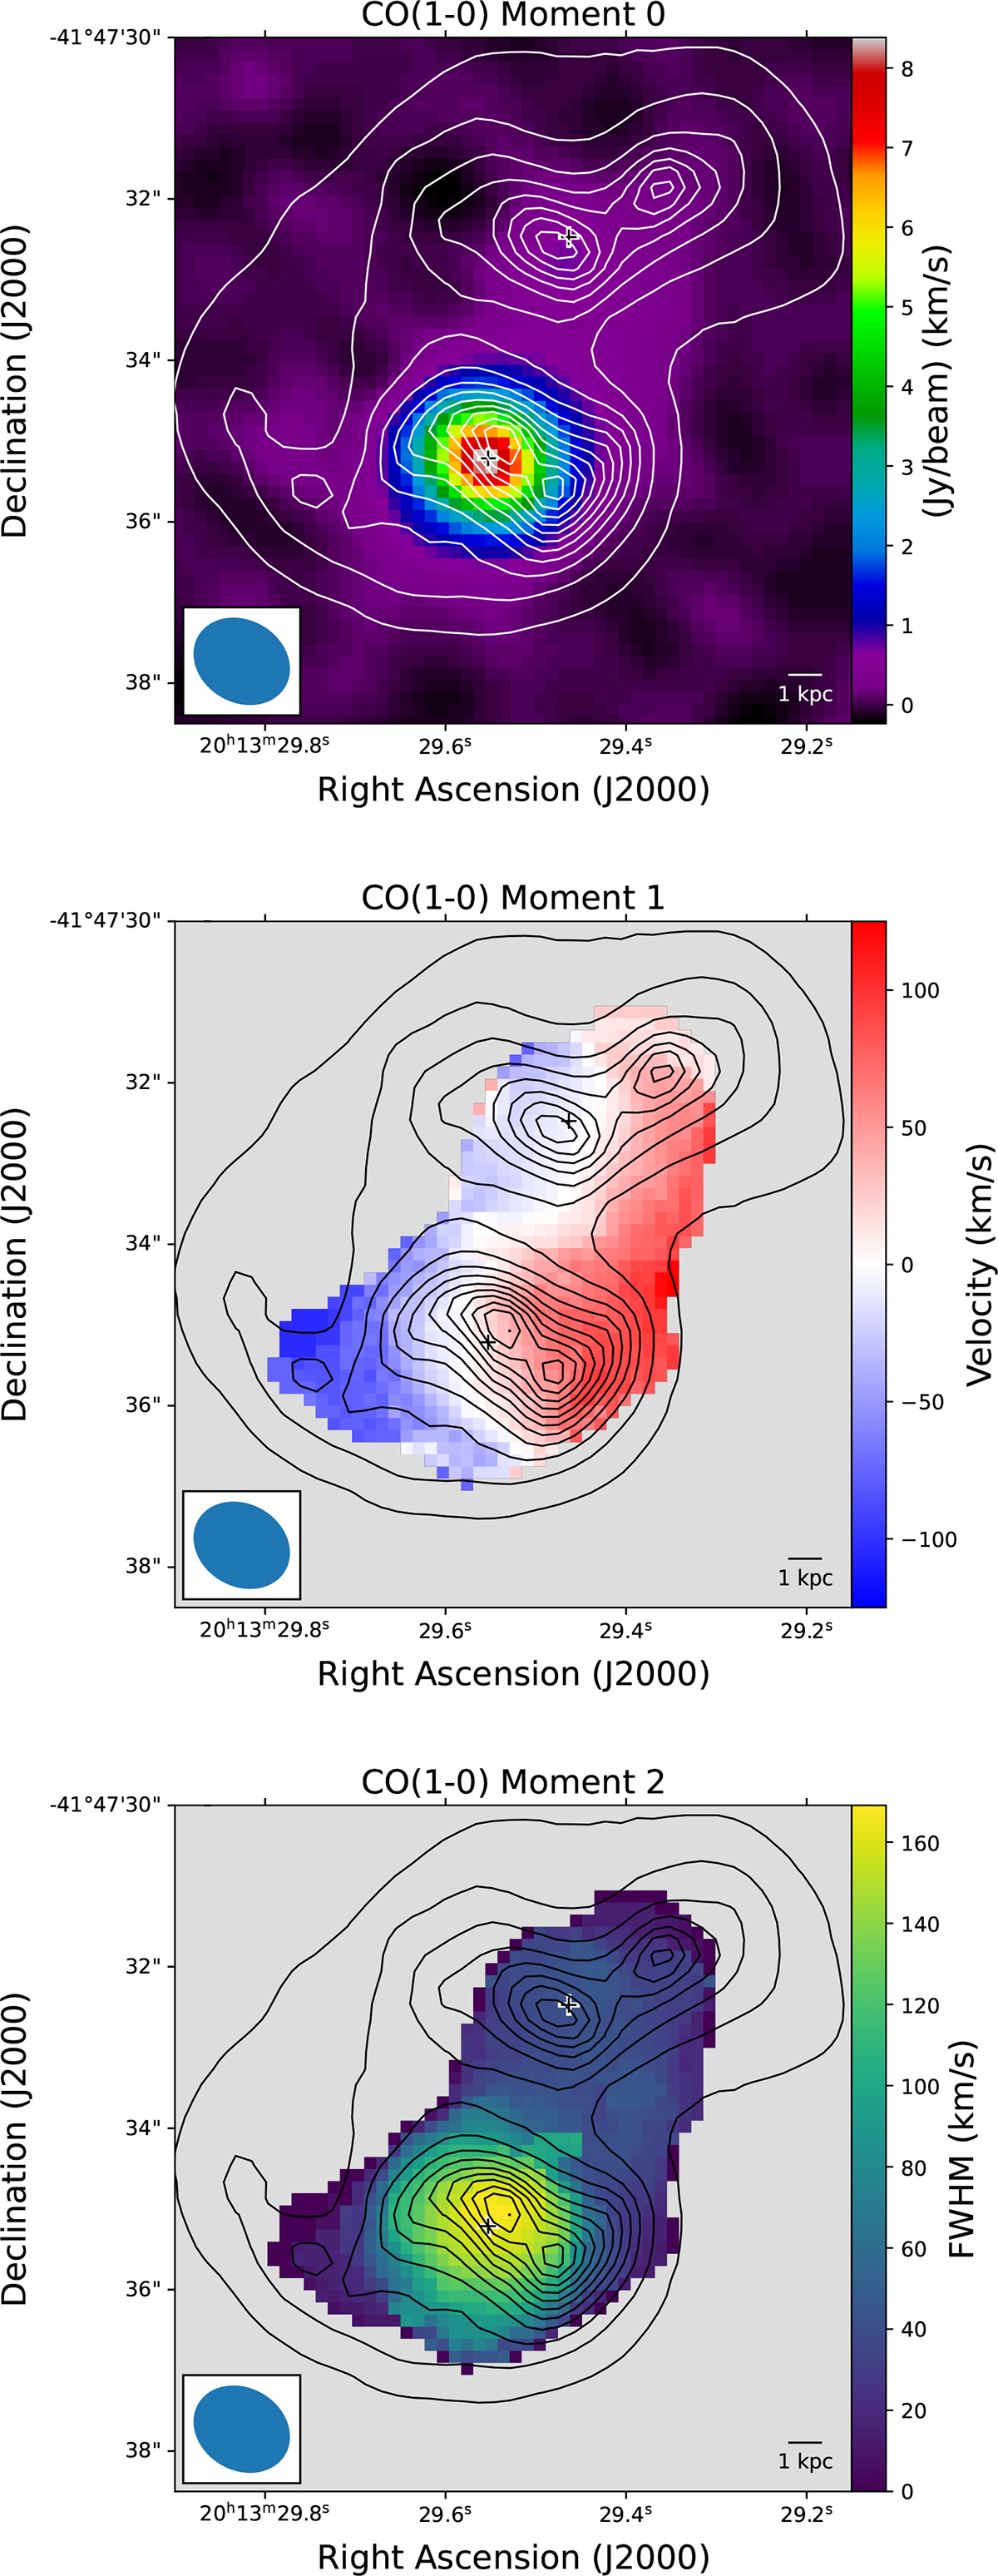
Moment maps of ALMA CO(1-0) data. The white (black in the second and third panels) contours show the stellar continuum emission observed with MUSE. The black and white markers show the positions of the CO(3-2) emission peaks in the SE and NW nuclei.
Current usage metrics show cumulative count of Article Views (full-text article views including HTML views, PDF and ePub downloads, according to the available data) and Abstracts Views on Vision4Press platform.
Data correspond to usage on the plateform after 2015. The current usage metrics is available 48-96 hours after online publication and is updated daily on week days.
Initial download of the metrics may take a while.