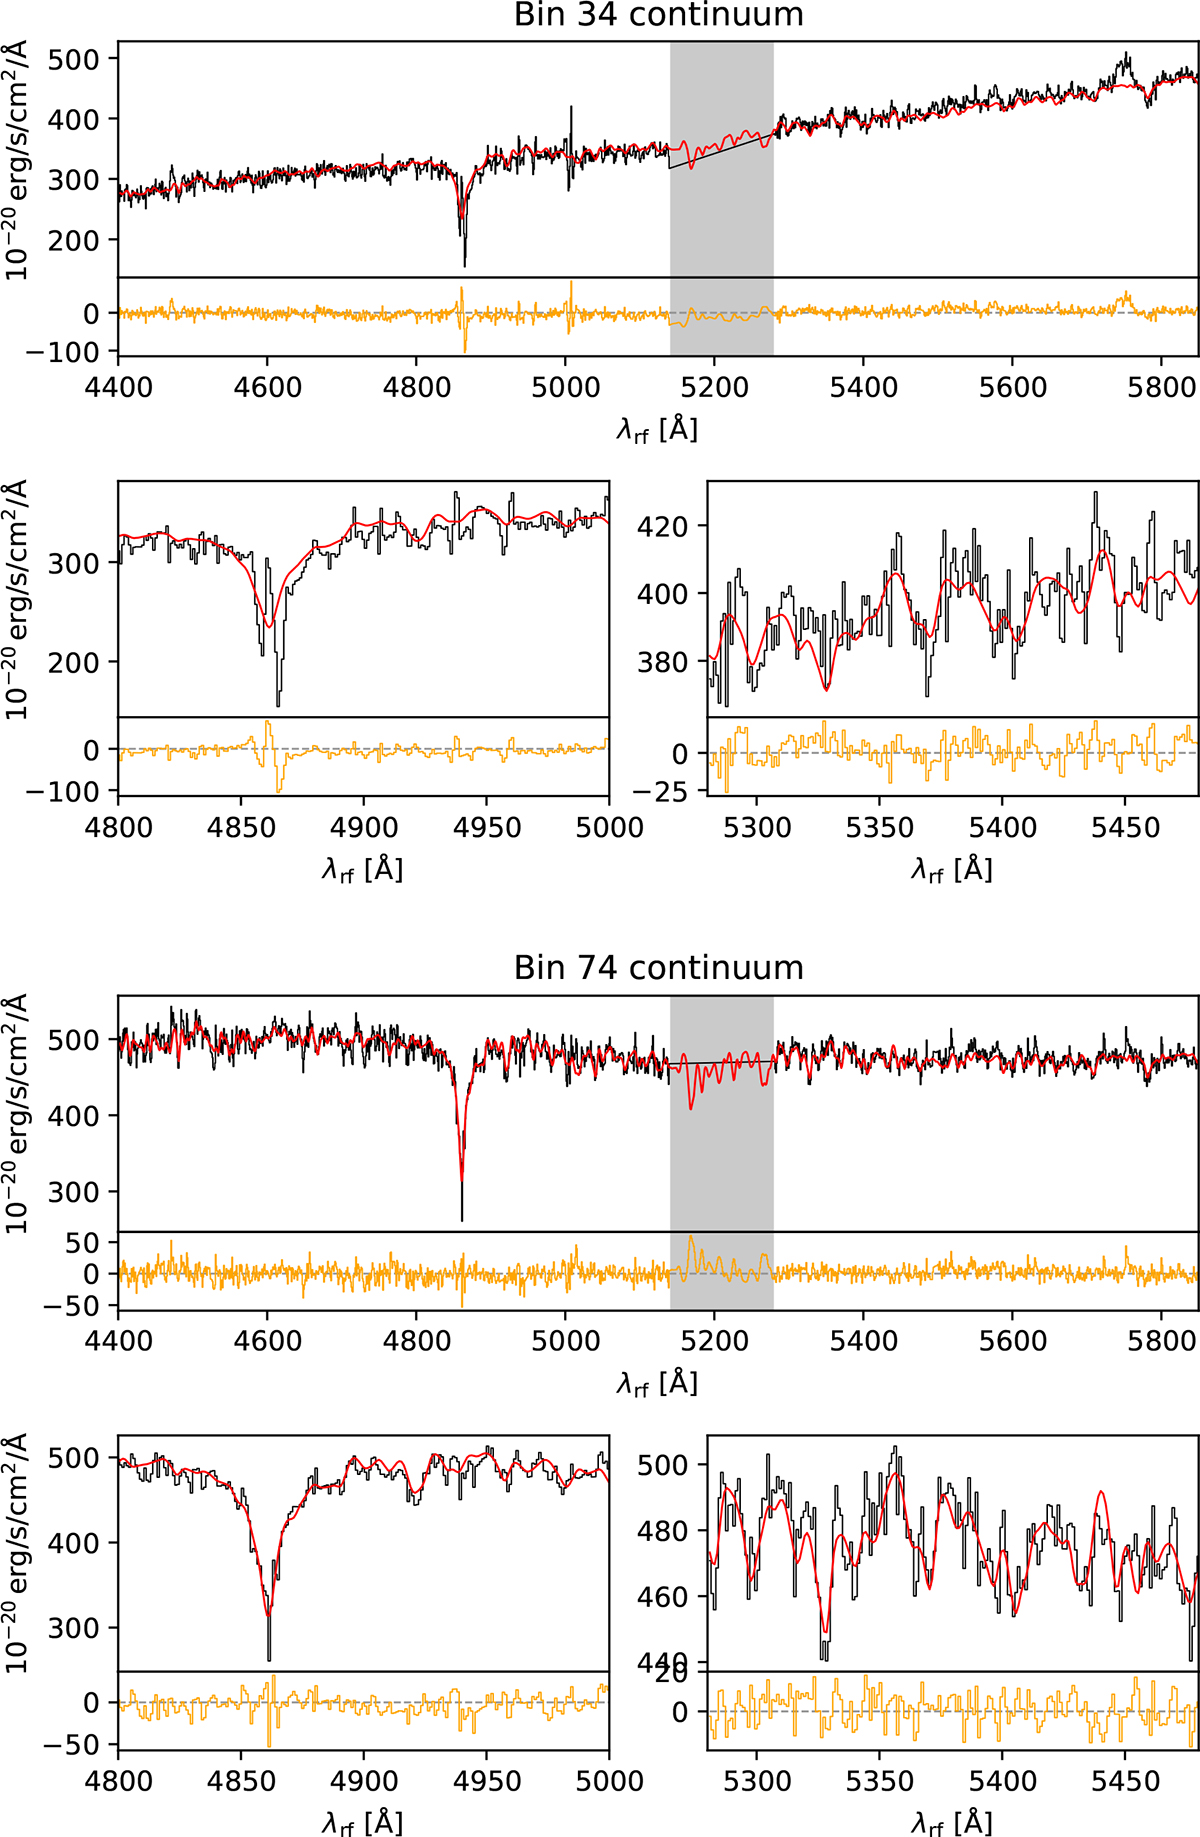
Fig. B.2.
Download original image
Examples of fits to the stellar continuum from the same bins as shown in Fig. B.1. The top panel for each bin shows the full spectral range of the continuum fit, with the gray shaded range indicating the portion of the spectrum masked due to the use of adaptive optics (AO). The smaller panels on the bottom show zoom-ins of a region around the Hβ absorption feature (left) and to the red side of the AO window (right) for each bin. In each panel, the spectrum with best-fit emission line templates subtracted is shown in black and the stellar template fit in red. The residual of the fit is shown in orange in the small panel below the fit for each region. The position of the bin is indicated by a green x on the stellar velocity map shown in Fig. B.1. The top panel shows a bin near the SE nucleus and the bottom panel a bin near the NW nucleus.
Current usage metrics show cumulative count of Article Views (full-text article views including HTML views, PDF and ePub downloads, according to the available data) and Abstracts Views on Vision4Press platform.
Data correspond to usage on the plateform after 2015. The current usage metrics is available 48-96 hours after online publication and is updated daily on week days.
Initial download of the metrics may take a while.