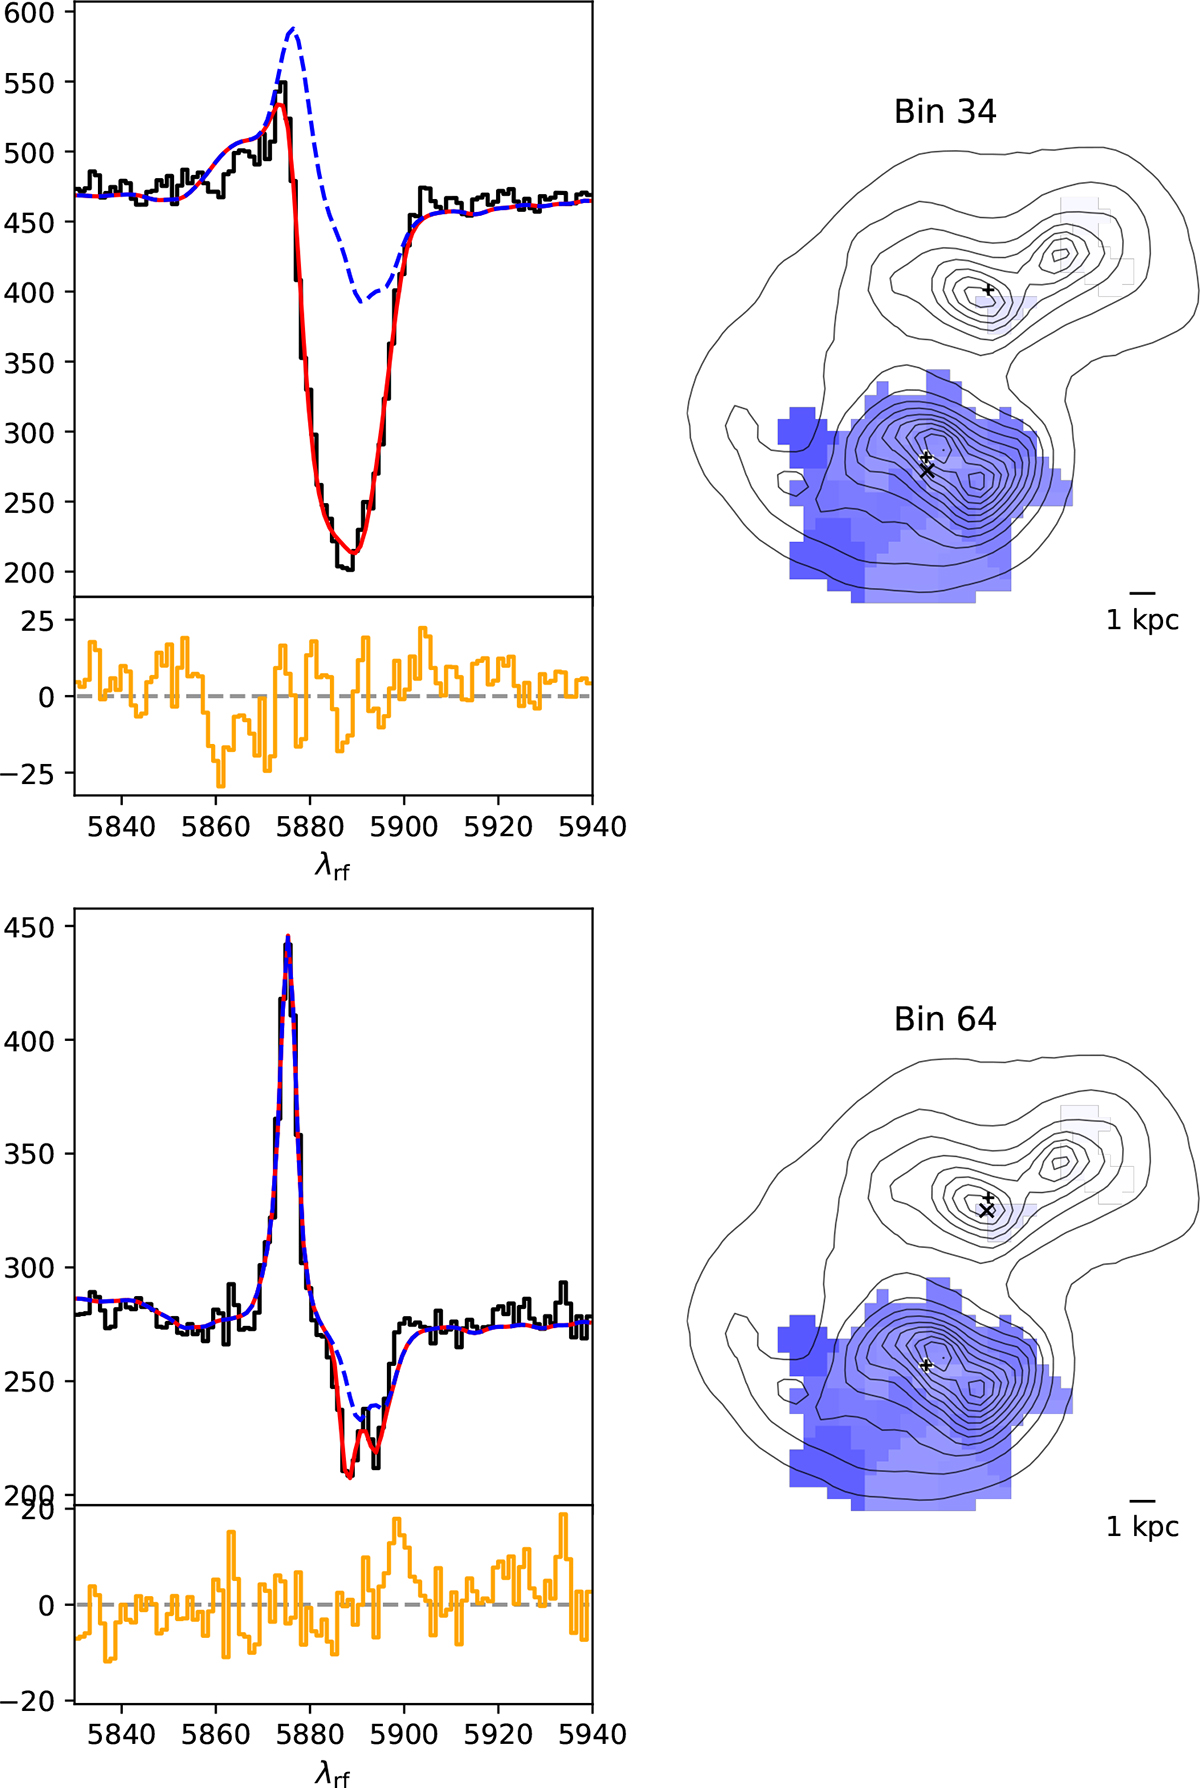
Fig. C.1.
Download original image
Examples of fits to the NaID absorption feature. The MUSE spectrum is shown in black, the total fit in red, and the best fit model without nebular NaID absorption (i.e., stars and HeI emission) in blue. The residual of the fit is shown in orange in the small panel below the fit for each region. The position of the bin is indicated by a black x on the sodium outflow velocity map shown on the right in each panel. The top panel shows a bin near the SE nucleus and the bottom panel a bin near the NW nucleus.
Current usage metrics show cumulative count of Article Views (full-text article views including HTML views, PDF and ePub downloads, according to the available data) and Abstracts Views on Vision4Press platform.
Data correspond to usage on the plateform after 2015. The current usage metrics is available 48-96 hours after online publication and is updated daily on week days.
Initial download of the metrics may take a while.