Open Access
Fig. F.2.
Download original image
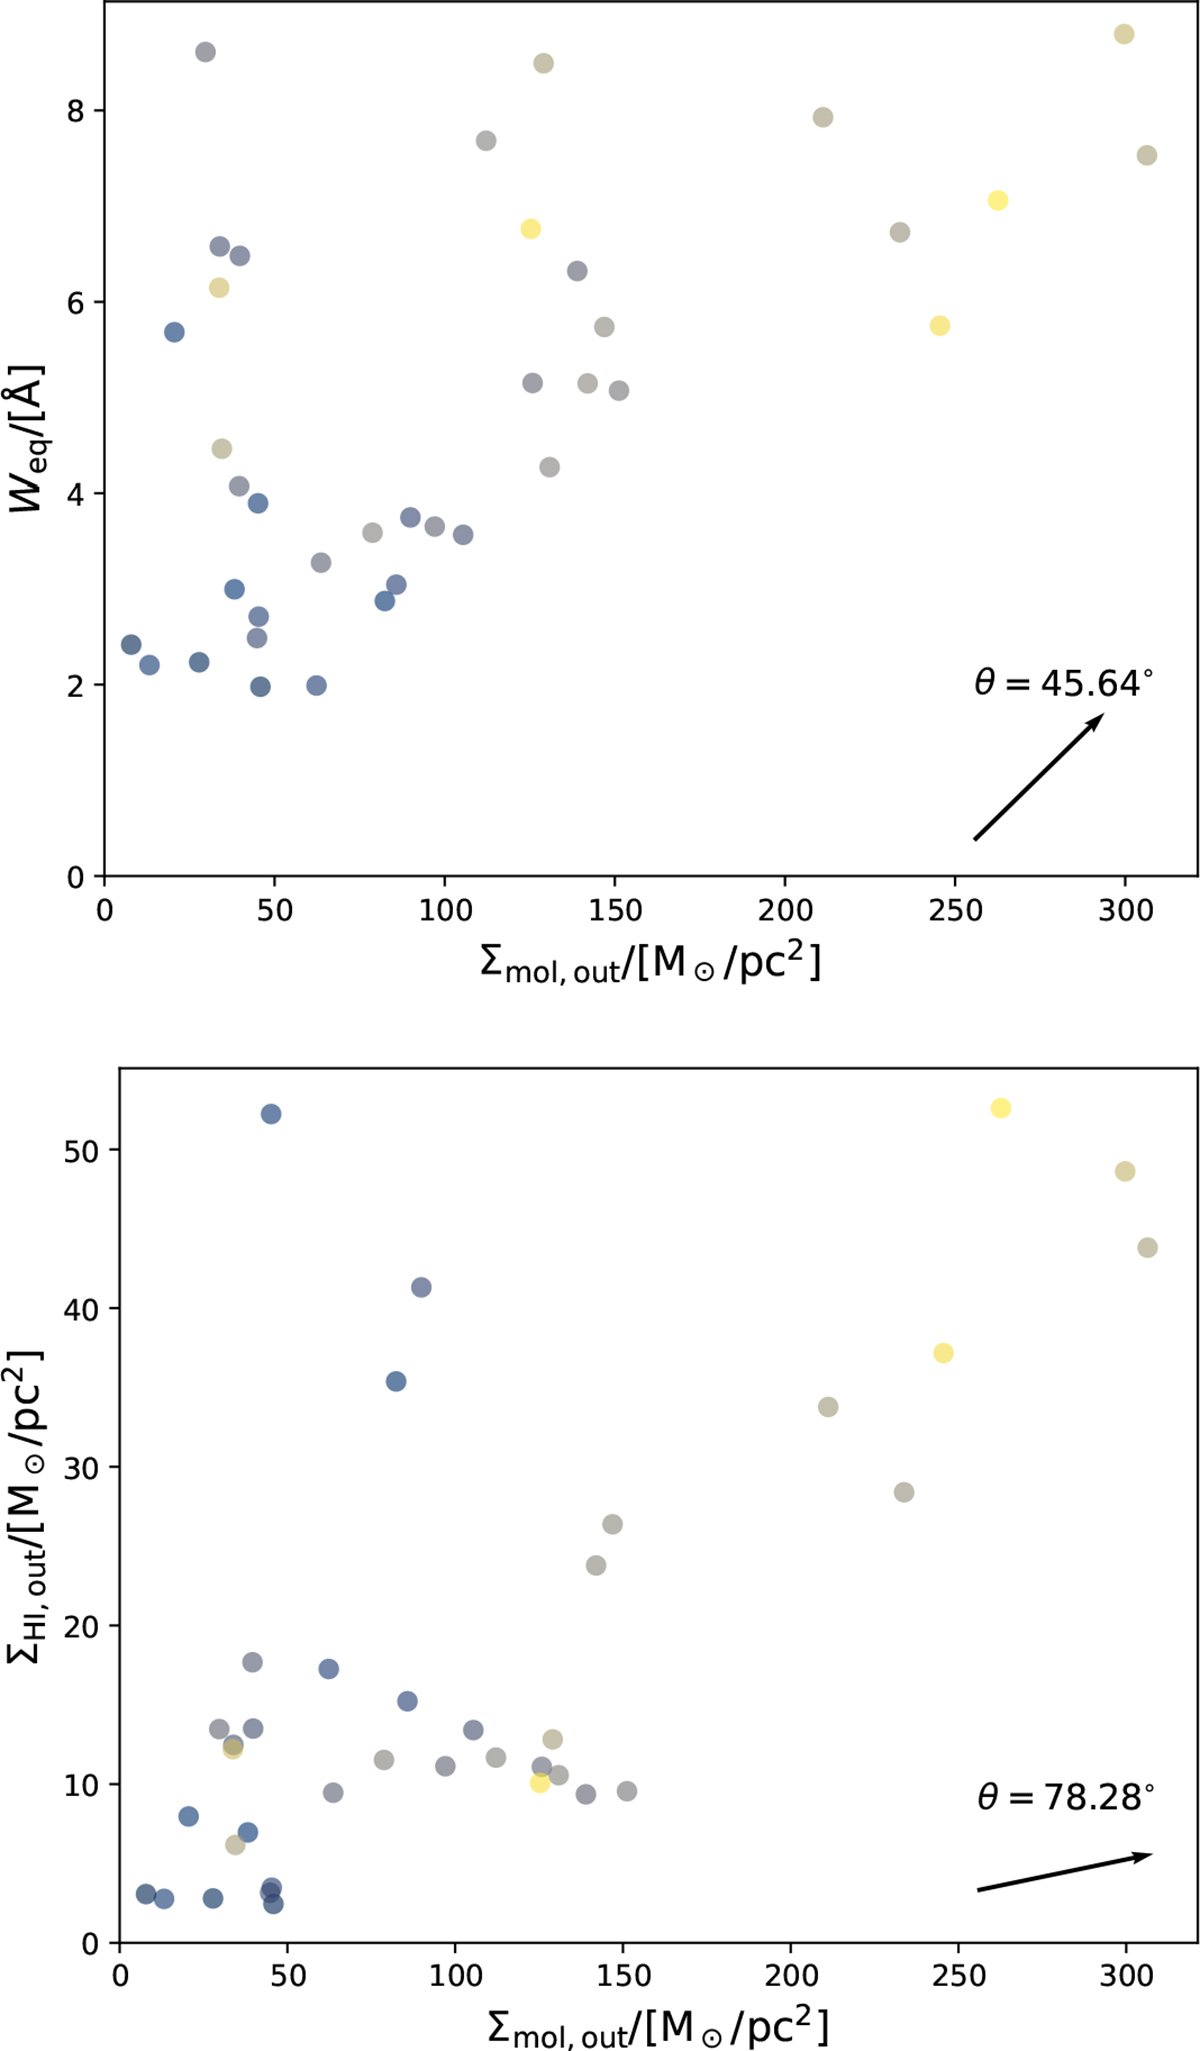
Molecular gas surface density in the outflow vs. NaID absorption EW (top) and neutral atomic hydrogen surface density (bottom). The color scaling corresponds to the diffuse dust extinction E(B-V) in each bin. Arrow shows the angle of maximum increase for E(B-V) in the plane.
Current usage metrics show cumulative count of Article Views (full-text article views including HTML views, PDF and ePub downloads, according to the available data) and Abstracts Views on Vision4Press platform.
Data correspond to usage on the plateform after 2015. The current usage metrics is available 48-96 hours after online publication and is updated daily on week days.
Initial download of the metrics may take a while.