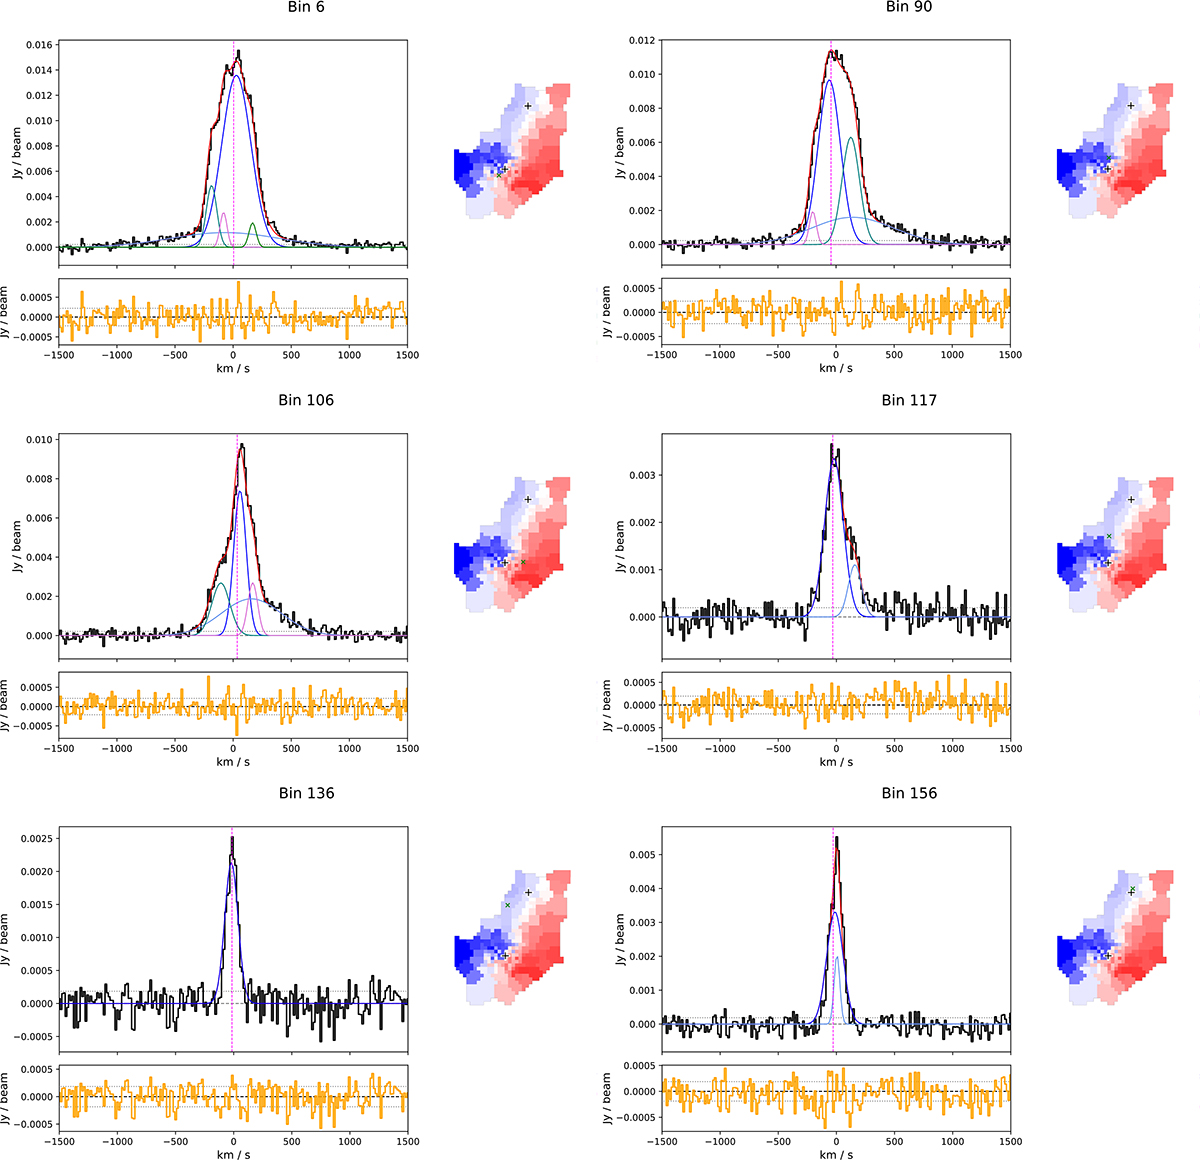
Fig. G.2.
Download original image
Examples of constrained multi-Gaussian fits used in the outflow identification process as described in Sect. 3.2. In black is the integrated spectrum extracted from a given Voronoi bin, in blue the gaussian component constrained to trace the quiescent gas following stellar kinematics, light blue, teal pink and green lines show additional components added to the fit in cases of complex line profiles. The magenta dashed line shows the central velocity of stars in the bin. The gray dotted line shows the noise level of the spectrum. The red solid line shows the sum of all components. The bottom panel shows the residual of the fit (data minus sum of all fit components) in orange and the noise level again as a dotted gray line. To the right of each plot is the position of the bin marked as a green x in the velocity map of the quiescent gas.
Current usage metrics show cumulative count of Article Views (full-text article views including HTML views, PDF and ePub downloads, according to the available data) and Abstracts Views on Vision4Press platform.
Data correspond to usage on the plateform after 2015. The current usage metrics is available 48-96 hours after online publication and is updated daily on week days.
Initial download of the metrics may take a while.