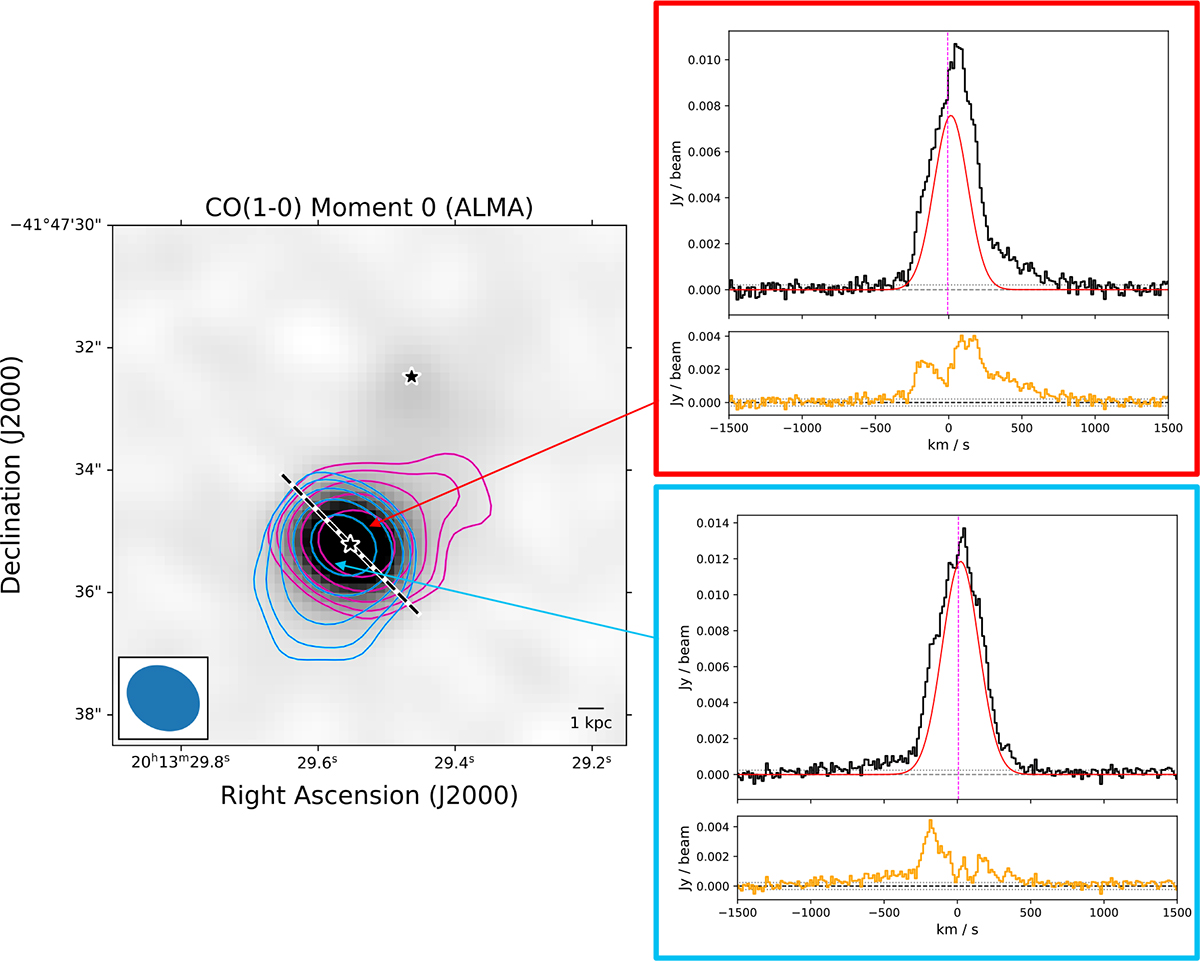
Fig. 3.
Download original image
Moment 0 map of CO(1-0) emission. The color map is cut at half the maximum to highlight fainter structure, saturating the SE nucleus. The black-and-white star markers show the positions of the CO(3-2) emission peaks in the SE and NW nuclei. The black-and-white dashed line shows the estimated orientation of the major axis in the SE disk. The cyan-and-blue (magenta-and-red) contours show the integrated intensity of emission from gas with velocities below –150 km/s (above 150 km/s) relative to the systemic velocity. The first two contour levels correspond to the 3σ and 5σ significance levels and every following step is doubled. The cyan and red framed panels show spectra of the CO(1-0) line (black) extracted from two positions along the minor axis. The vertical magenta dashed line in the extracted spectra shows the line-of-sight velocity of the stellar component at that position. The red line profile corresponds to the fitted quiescent gas components. The bottom panel shows the spectrum of the outflowing gas in orange. In both panels, dashed horizontal lines show the zero-level and dotted horizontal lines the 1σ noise level.
Current usage metrics show cumulative count of Article Views (full-text article views including HTML views, PDF and ePub downloads, according to the available data) and Abstracts Views on Vision4Press platform.
Data correspond to usage on the plateform after 2015. The current usage metrics is available 48-96 hours after online publication and is updated daily on week days.
Initial download of the metrics may take a while.