Fig. 4.
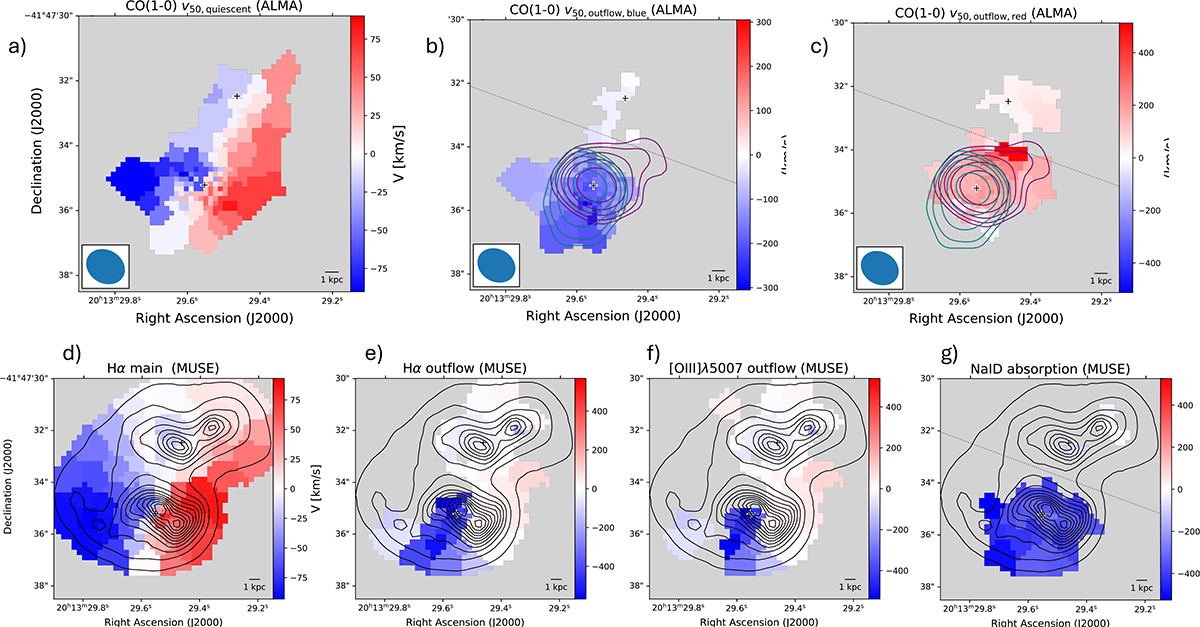
Download original image
Velocity maps of quiescent and outflowing gas in the cold molecular, ionized and neutral gas phases. Top row: Maps of v50 for the quiescent CO(1-0) emission (a), blueshifted outflowing (b), and redshifted outflowing (c) gas. The cyan-and-blue (magenta-and-red) contours show the integrated intensity of emission from gas with velocities below –150 km/s (above 150 km/s) relative to the systemic velocity. The first two contour levels correspond to the 3σ and 5σ significance levels and every following step is doubled. The dotted lines in the outflow panels show the borders according to which bins are associated with the SE and NW nuclei when calculating total outflow properties. Bottom row: Velocity maps based on MUSE data. Quiescent ionized gas traced by Hα (d), and outflowing ionized gas traced by Hα (e) and by [OIII]λ5007 emission (f). Panel (g) shows the best-fit velocity map of the neutral outflowing gas traced by NaID absorption. The black contours show the stellar continuum emission integrated over the spectral range. We do not show the quiescent component traced by [OIII]λ5007, as kinematics are tied between this line and Hα in the fit and the quiescent component is detected in every bin, so that this map would be identical to that of quiescent Hα.
Current usage metrics show cumulative count of Article Views (full-text article views including HTML views, PDF and ePub downloads, according to the available data) and Abstracts Views on Vision4Press platform.
Data correspond to usage on the plateform after 2015. The current usage metrics is available 48-96 hours after online publication and is updated daily on week days.
Initial download of the metrics may take a while.