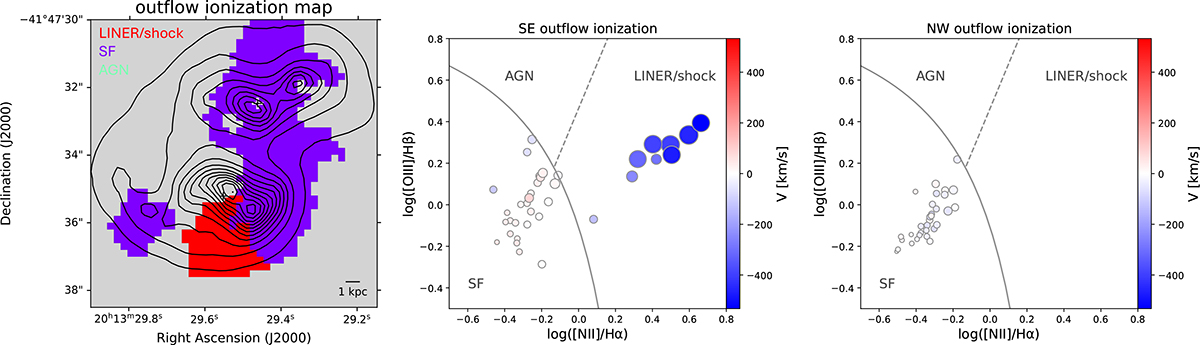
Fig. 5.
Download original image
BPT classification of outflowing gas by Voronoi bins. In the maps, purple bins are dominated by SF/composite-like, red bins by shock and LINER-like, and mint bins by AGN-like (Seyfert) ionization. Contours correspond to the stellar continuum flux. In the BPT diagrams symbol color corresponds to central velocity of the fit component and symbol size (diameter) corresponds to velocity dispersion σ. The solid line shows the theoretical maximum for ionization due to star-formation from Kewley et al. (2001) and the dashed line shows the demarcation between Seyfert (above the line) and LINER- or shock-like ionization (below the line) suggested by Kauffmann et al. (2003).
Current usage metrics show cumulative count of Article Views (full-text article views including HTML views, PDF and ePub downloads, according to the available data) and Abstracts Views on Vision4Press platform.
Data correspond to usage on the plateform after 2015. The current usage metrics is available 48-96 hours after online publication and is updated daily on week days.
Initial download of the metrics may take a while.