Fig. 7.
Download original image
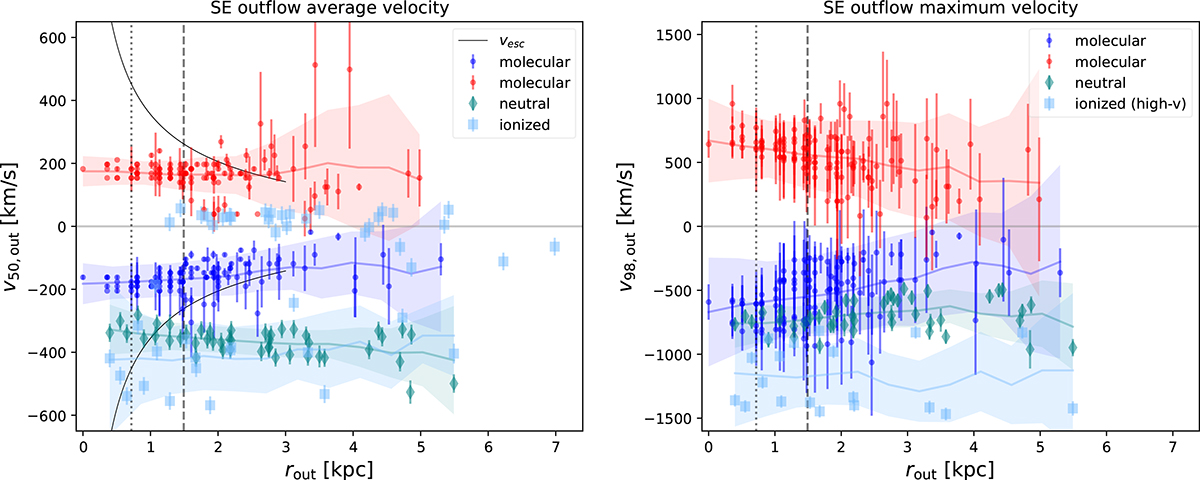
Average (left) and maximum (right) outflow velocities vs. distance from center for each Voronoi bin. Blue (red) dots show the blueshifted (redshifted) molecular outflow, teal diamonds show the neutral outflow, and light blue squares show the ionized outflow. The dashed (dotted) vertical line shows the adopted lower limit on rout based on the ALMA (MUSE) angular resolution. We also show the running mean (with a uniform 2 kpc kernel) velocity for each phase (only the high-v bins for the ionized gas) as a solid line and its estimated uncertainty as a shaded area in the corresponding colors. The solid black curves in the left panel indicate the estimated escape velocity based on the dynamical mass of the SE merger component from Perna et al. (2022).
Current usage metrics show cumulative count of Article Views (full-text article views including HTML views, PDF and ePub downloads, according to the available data) and Abstracts Views on Vision4Press platform.
Data correspond to usage on the plateform after 2015. The current usage metrics is available 48-96 hours after online publication and is updated daily on week days.
Initial download of the metrics may take a while.