Fig. 5.
Download original image
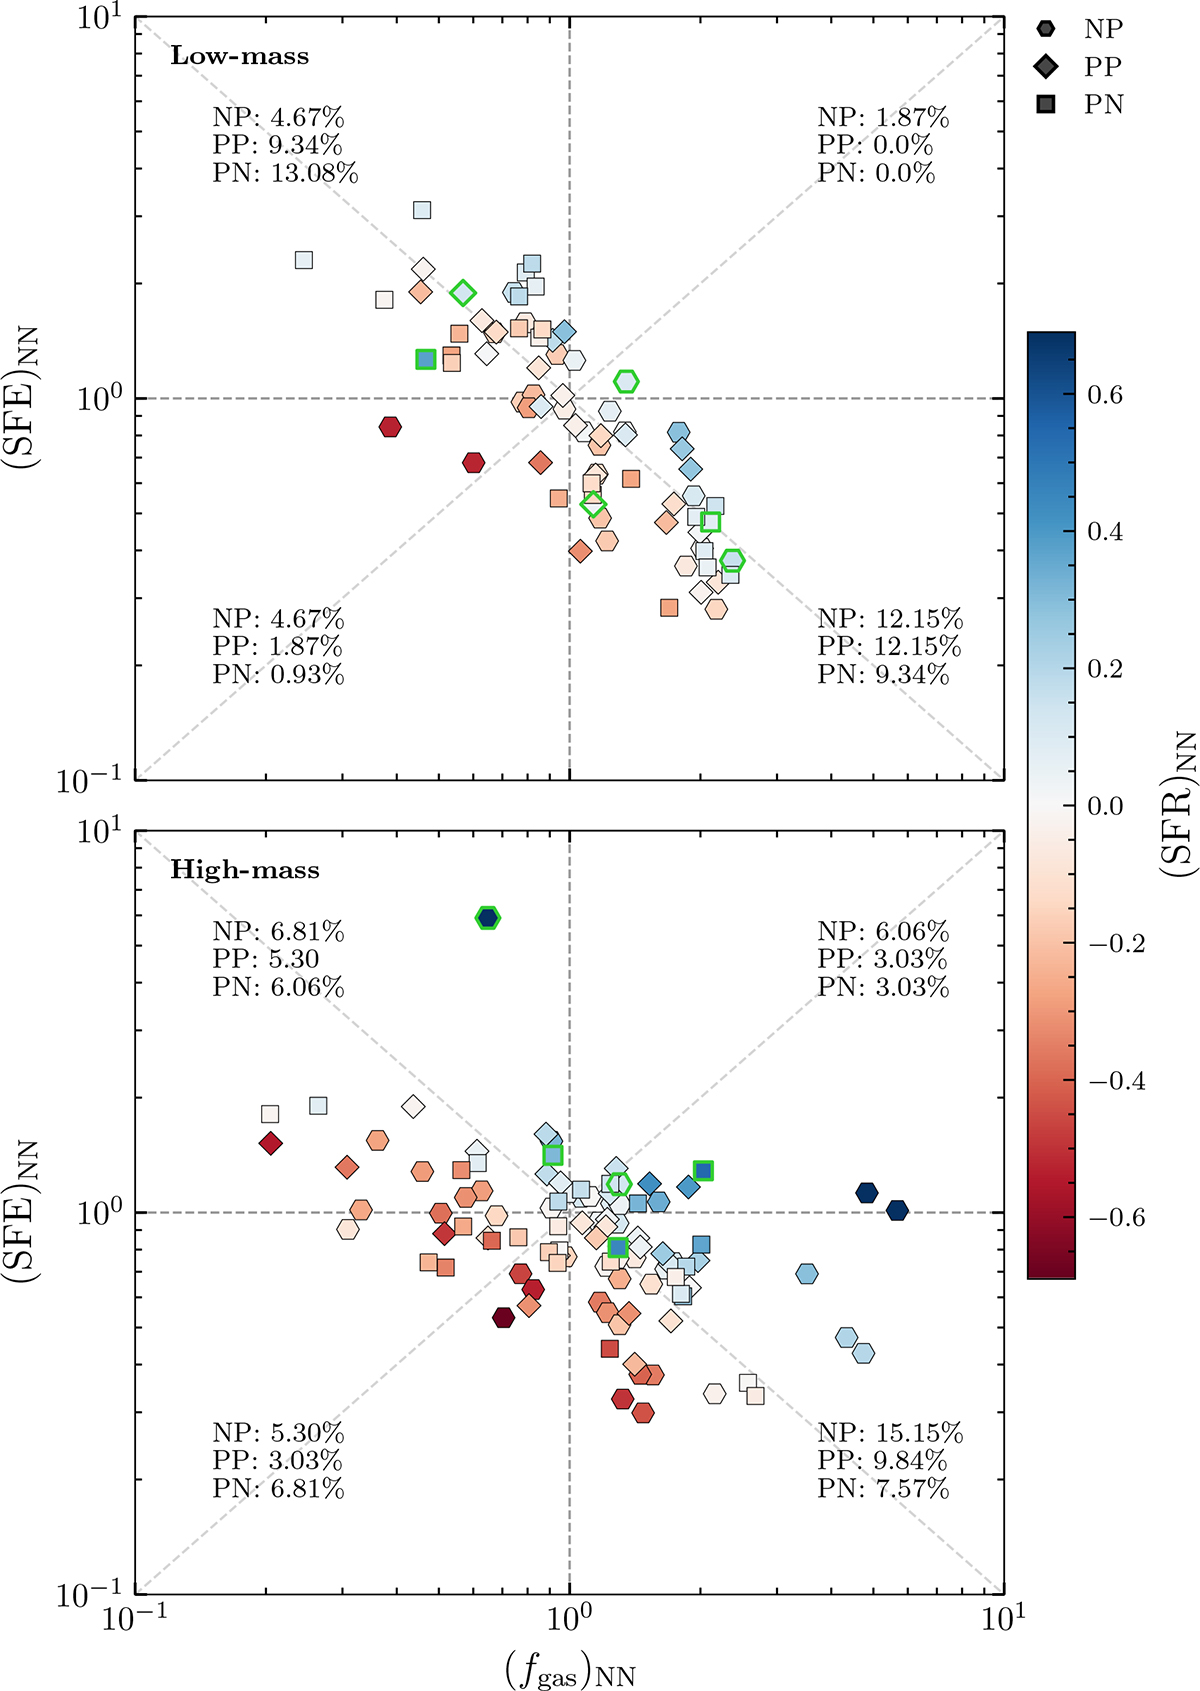
SFE as a function of gas fraction (fgas) for PP, NP, and PN galaxies in the low-mass (upper panel) and high-mass (lower panel) bins. All parameters are expressed relatively to those of NN galaxies at a given M★. The coloured map represents the normalised SFR, while green borders around the data points highlight galaxies that increased their stellar mass by more than 25% within 2.5 Gyr (τ25 < 2.5 Gyr). The percentages of each galaxy type within each quadrant are included.
Current usage metrics show cumulative count of Article Views (full-text article views including HTML views, PDF and ePub downloads, according to the available data) and Abstracts Views on Vision4Press platform.
Data correspond to usage on the plateform after 2015. The current usage metrics is available 48-96 hours after online publication and is updated daily on week days.
Initial download of the metrics may take a while.