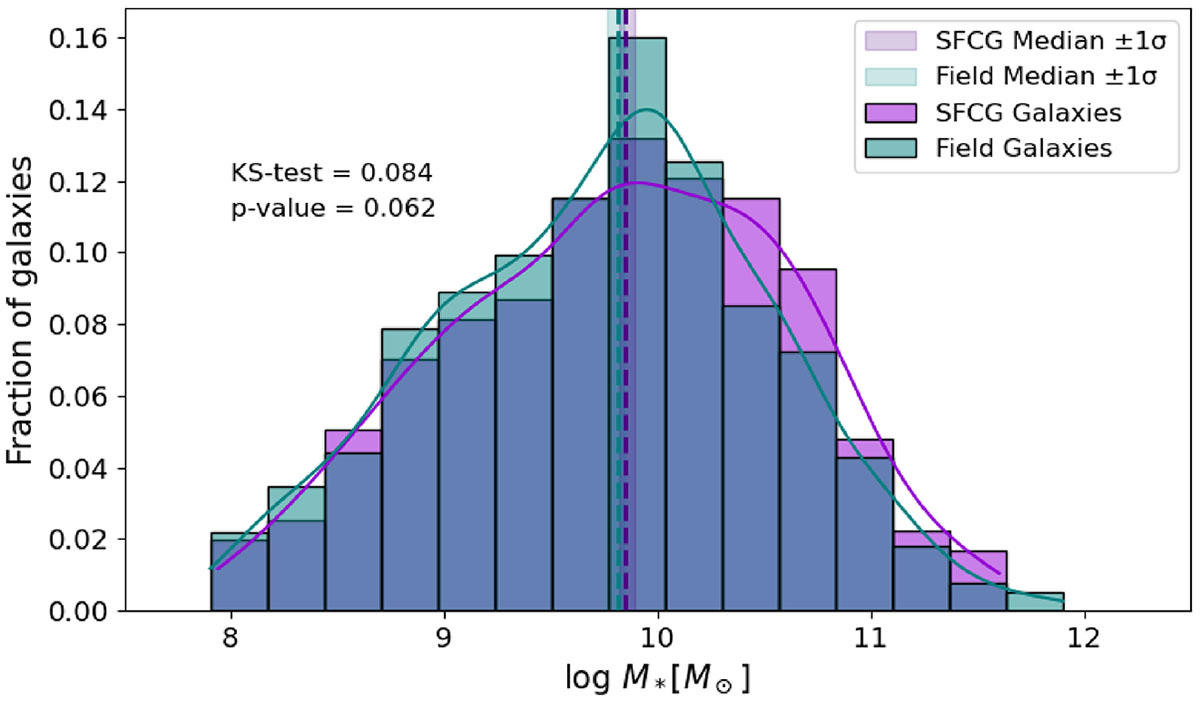
Fig. 1.
Download original image
Mass distribution of the galaxies in the SFCGs and FGs. The y-axis shows the fraction of galaxies with respect to the total of each sample. Dashed lines represent the median of each distribution. In violet are the SFCGs, and the FGs are in teal. The shaded regions are 1σ uncertainties around the median value of the distributions, obtained using bootstrapping. The violet and teal curves show the KDE for the distributions.
Current usage metrics show cumulative count of Article Views (full-text article views including HTML views, PDF and ePub downloads, according to the available data) and Abstracts Views on Vision4Press platform.
Data correspond to usage on the plateform after 2015. The current usage metrics is available 48-96 hours after online publication and is updated daily on week days.
Initial download of the metrics may take a while.