Open Access
Fig. 5.
Download original image
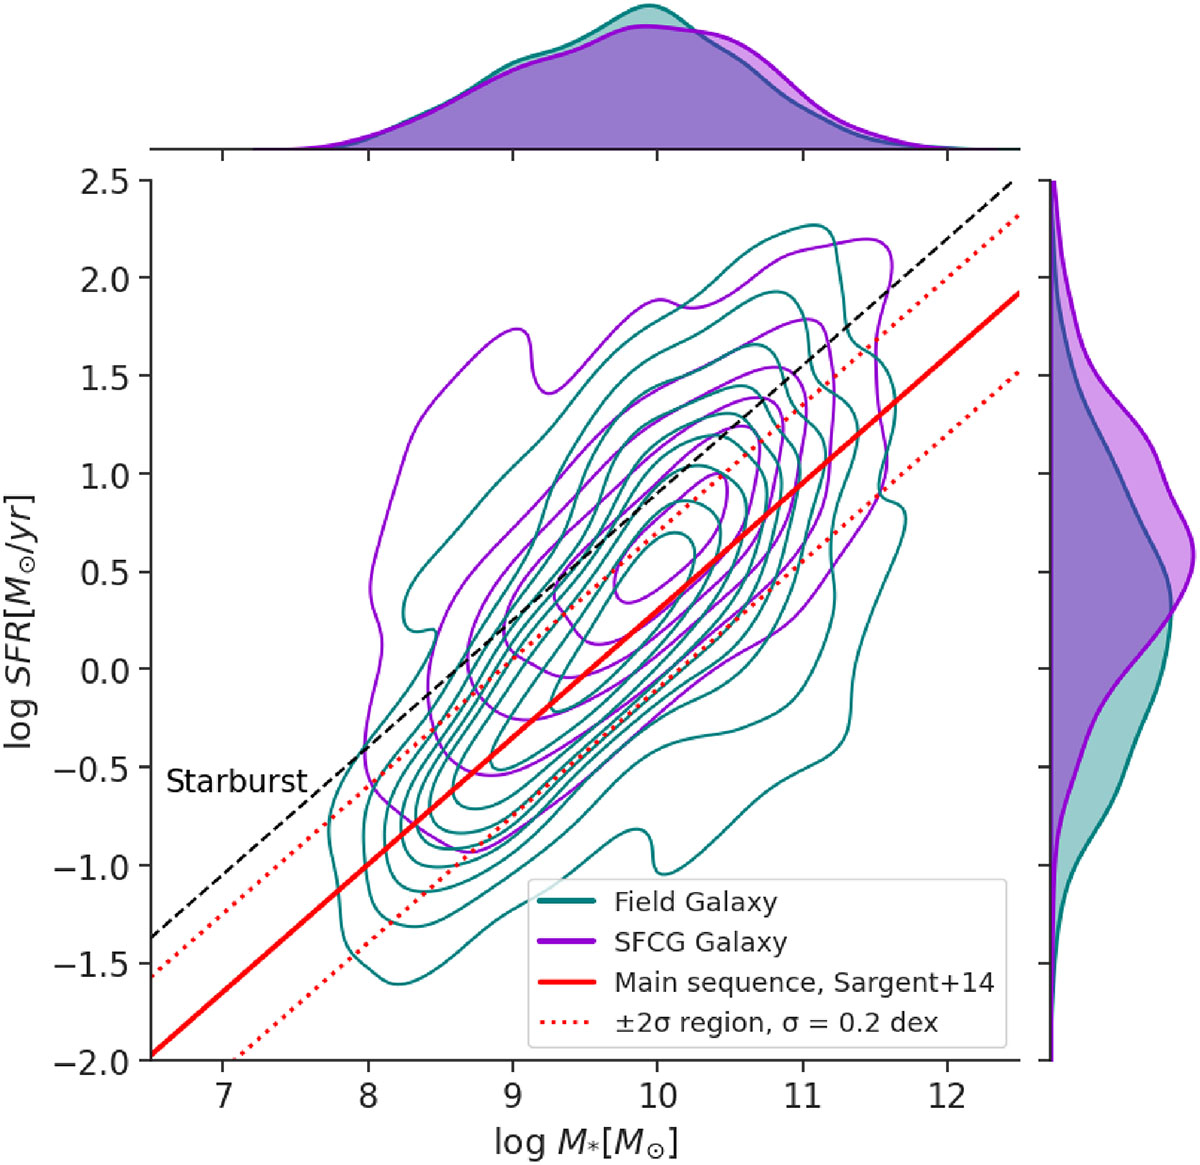
Star formation rate compared against stellar mass KDE contours for galaxies in the SFCGs (violet) and the field (teal). The dashed black line represents the division between starburst and no starburst galaxies (Jarvis et al. 2020), and the red line represents the main sequence (Sargent et al. 2014).
Current usage metrics show cumulative count of Article Views (full-text article views including HTML views, PDF and ePub downloads, according to the available data) and Abstracts Views on Vision4Press platform.
Data correspond to usage on the plateform after 2015. The current usage metrics is available 48-96 hours after online publication and is updated daily on week days.
Initial download of the metrics may take a while.