Fig. 6.
Download original image
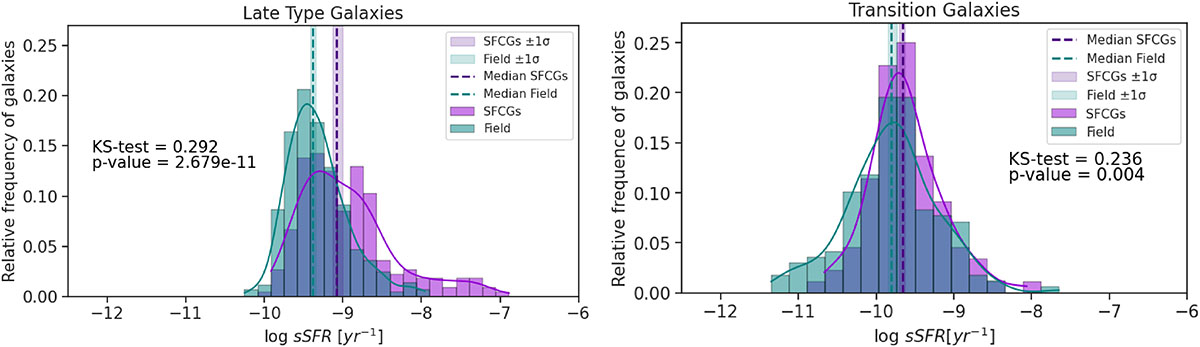
Specific star formation rate for galaxies in the SFCGs (violet) and in the field (teal). The left panel shows the distribution of the LTGs, and the right panel shows the distribution for transition galaxies. The dashed line shows the median of the distribution, and the shaded regions are the 1σ uncertainty of the median value using bootstrapping.
Current usage metrics show cumulative count of Article Views (full-text article views including HTML views, PDF and ePub downloads, according to the available data) and Abstracts Views on Vision4Press platform.
Data correspond to usage on the plateform after 2015. The current usage metrics is available 48-96 hours after online publication and is updated daily on week days.
Initial download of the metrics may take a while.