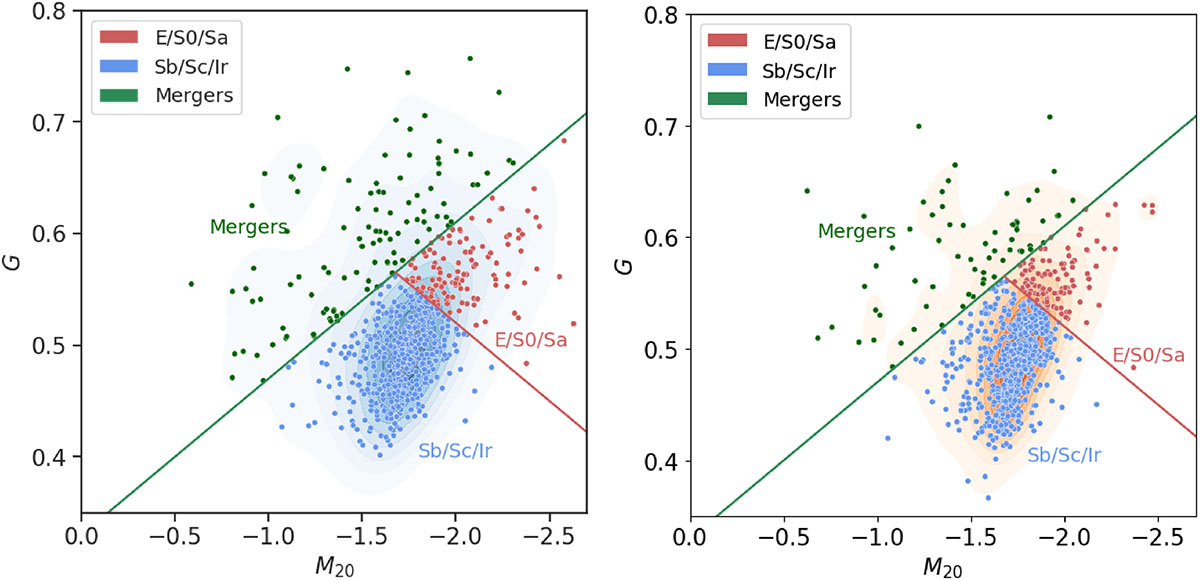
Fig. 7.
Download original image
Galaxy classification according to their Gini and M20 indices. The blue, red, and green dots correspond to Sb/Sc/Ir, E/S0/Sa, and merger-type galaxies, respectively. The left panel corresponds to the SFCGs, while the right panel corresponds to the FGs. The G-M20 plane and the KDE were built using 678 and 761 galaxies with reliable parameters from SFCGs and the field, respectively.
Current usage metrics show cumulative count of Article Views (full-text article views including HTML views, PDF and ePub downloads, according to the available data) and Abstracts Views on Vision4Press platform.
Data correspond to usage on the plateform after 2015. The current usage metrics is available 48-96 hours after online publication and is updated daily on week days.
Initial download of the metrics may take a while.