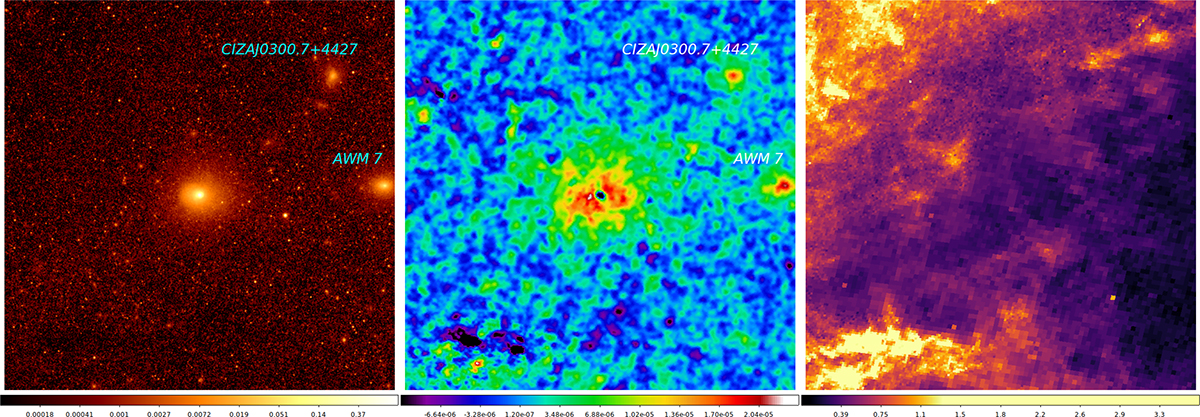
Fig. 1.
Download original image
10 × 10 degrees patch of the sky centered at the Perseus cluster in equatorial coordinates. The estimated turnaround radius of the Perseus cluster is ∼7°, i.e., the entire image falls within the turnaround radius. Left: eROSITA 0.4–2.3 keV X-ray image; middle: y-map from PLANCK based on PR4 maps (see Chandran et al. 2023); right: dust extinction map (based on Green et al. 2019). Two X-ray and SZ-bright objects on the right are the galaxy clusters AWM7/2A0251+413 (z ∼ 0.0172) and CIZAJ0300.7+4427 (z ∼ 0.030). These two clusters possibly trace the topology of LSS filaments, in particular, AWM7, which belongs to the Perseus-Pisces supercluster (e.g., Böhringer et al. 2021). CIZAJ0300.7+4427 belongs to another (more distant) filament, which is also seen in the distribution of galaxies (see Sect. 2.2). The correspondence between X-ray and Y maps is very good, with the visible SZ signal being less peaked at the center but, as expected, extending to large radii. The “dip” in the very core of the y-map is due to contamination by the radio galaxy NGC1275 (Perseus A) and its immediate vicinity. The right figure shows the complexity of the foreground distribution of the Milky Way gas (as traced by dust) in the direction of Perseus. The map is plotted in units of AV extinction.
Current usage metrics show cumulative count of Article Views (full-text article views including HTML views, PDF and ePub downloads, according to the available data) and Abstracts Views on Vision4Press platform.
Data correspond to usage on the plateform after 2015. The current usage metrics is available 48-96 hours after online publication and is updated daily on week days.
Initial download of the metrics may take a while.