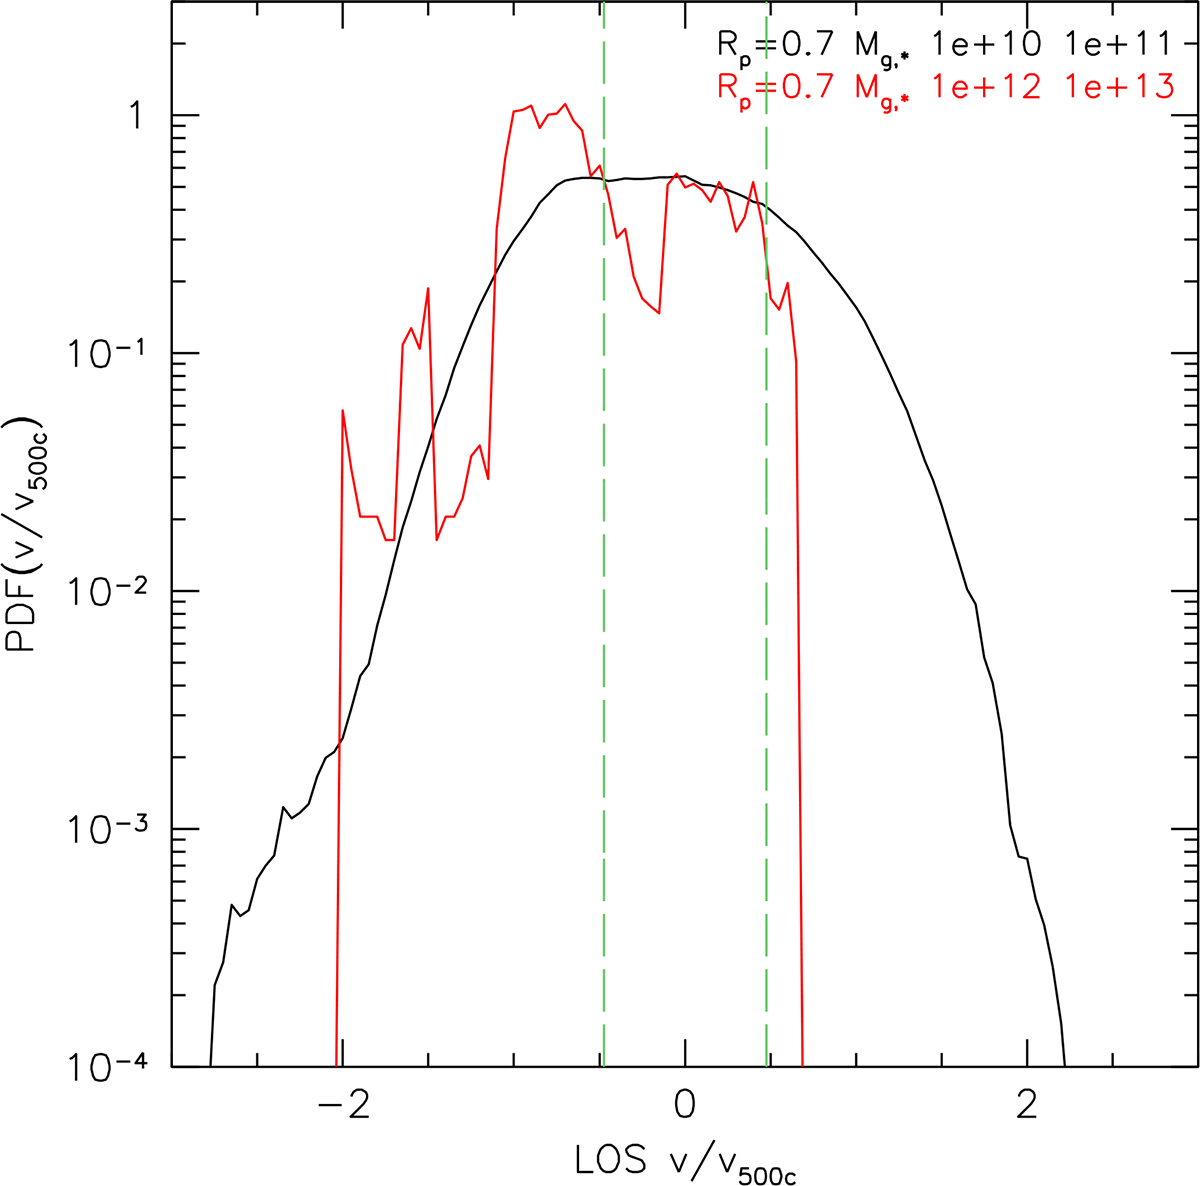
Fig. 11.
Download original image
IC310 case – massive group at projected distance Rp = 0.7R500c. The plot is similar to Fig. 10 but now the red curve shows PDF(V) for massive subhalos with stellar mass in the range 1012 − 1013 M⊙. This distribution is now very asymmetric between infalling and outgoing halos, presumably due to dynamic friction. The IC310 has a small LOS velocity, consistent with an object not far from the pericenter. The Hubble expansion is not added to galaxies’ velocities.
Current usage metrics show cumulative count of Article Views (full-text article views including HTML views, PDF and ePub downloads, according to the available data) and Abstracts Views on Vision4Press platform.
Data correspond to usage on the plateform after 2015. The current usage metrics is available 48-96 hours after online publication and is updated daily on week days.
Initial download of the metrics may take a while.