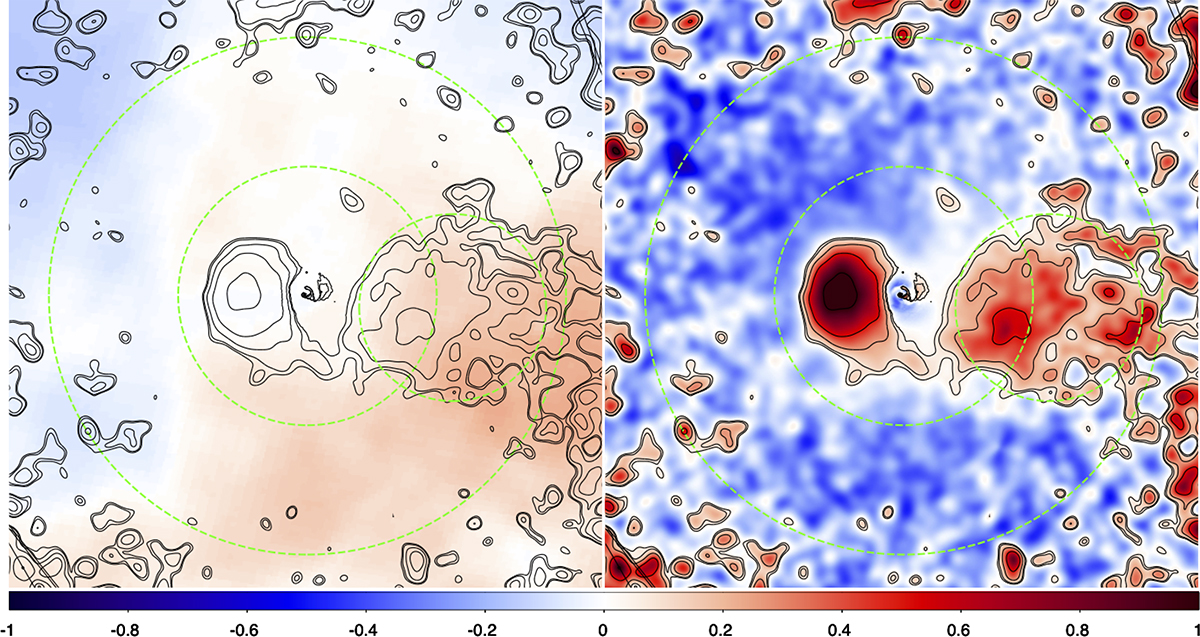
Fig. D.1.
Download original image
Expected modulation of the X-ray flux (left panel) due to variation of the photoelectric absorption in the Galaxy in azimuthal direction (i.e., relative to the mean value at the same distance from NGC1275). The modulation was computed for the 0.4-2.3 keV energy range, taking into account the eROSITA response. For comparison, the right panel shows the observed azimuthal variations of the X-ray flux in the same color scale. Clearly, the observed variations are several times larger than expected due to absorption. The two large dashed circles correspond to 0.5 × R200c and R200c. The smaller circle to the West of the core outlines the region of the most prominent patch of the excess X-ray emission, presumably caused by merger(s) along the largest filament crossing the Perseus cluster. The contours of the elevated X-ray surface brightness are shown in both panels for comparison.
Current usage metrics show cumulative count of Article Views (full-text article views including HTML views, PDF and ePub downloads, according to the available data) and Abstracts Views on Vision4Press platform.
Data correspond to usage on the plateform after 2015. The current usage metrics is available 48-96 hours after online publication and is updated daily on week days.
Initial download of the metrics may take a while.